
Fig. 1
- ID
- ZDB-IMAGE-260203-7
- Genes
- Publication
- Herget et al., 2025 - Pth4 neurons define a novel hypothalamic circuit that promotes sleep via brainstem monoaminergic neurons
- All Figures
- Figures for Herget et al., 2025
|
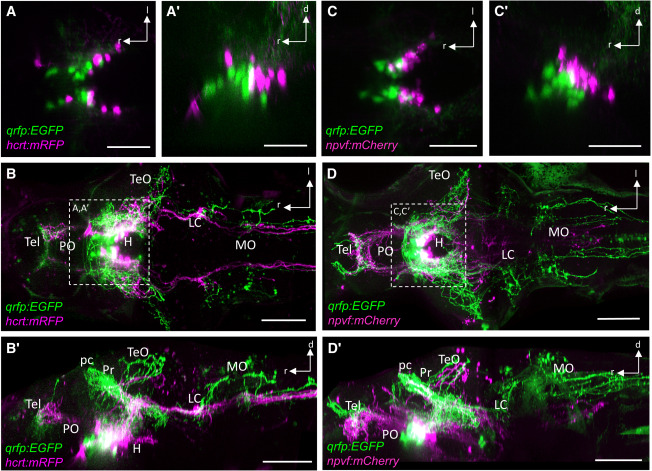
Fig. 1 QRFP, Hcrt, and NPVF are expressed in distinct neuronal populations in the larval zebrafish hypothalamus Dorsal (A–D) and lateral (A′–D′) maximum intensity projection views of live 5-dpf zebrafish that express EGFP in QRFP neurons and mRFP in Hcrt neurons (A–B′) or mCherry in NPVF neurons (C–D′). (A, A′, C, and C′) Substacks showing hypothalamic somata. (B, B′, D, and D′) Whole-brain stacks with increased signal intensity to show neuronal projections. Boxed regions in (B) and (D) are shown with reduced signal intensity in (A), (A′), (C), and (C′). l, lateral; d, dorsal; r, rostral; H, hypothalamus; LC, locus coeruleus; MO, medulla oblongata; pc, posterior commissure; Pr, pretectum; PO, preoptic area; Tel, telencephalon; TeO, optic tectum. Scale bars, 50 μm (A, A′, C, and C′), 100 μm (B, B′, D, and D′). See also Videos S1 and S2.