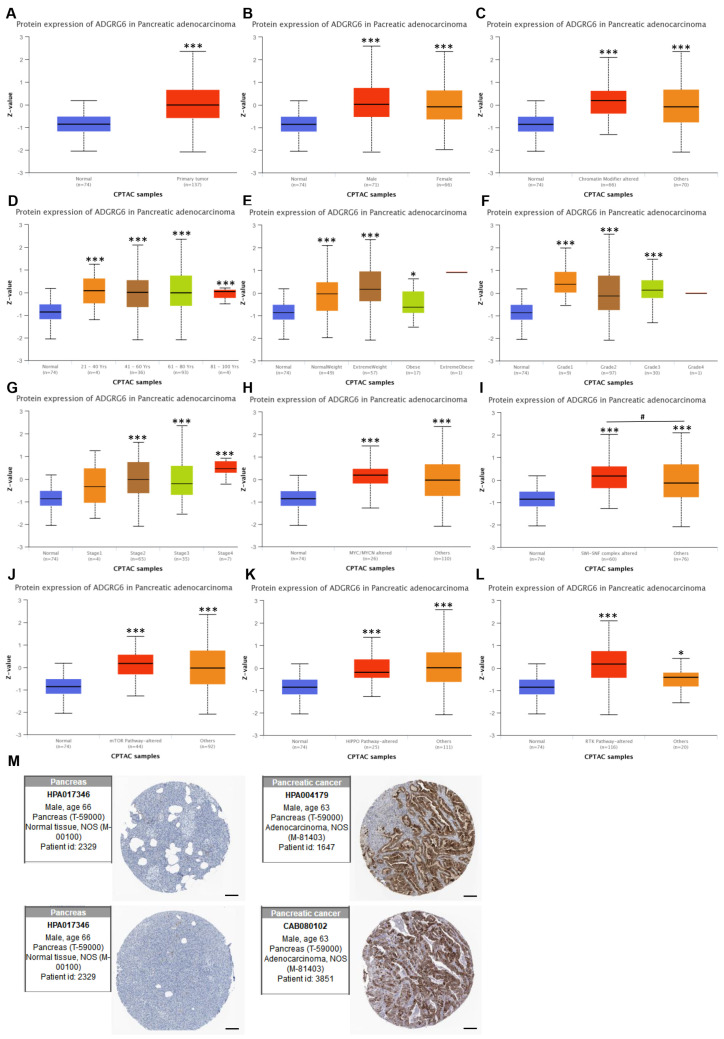
Protein expression of ADGRG6 in PAAD based on UALCAN and HPA databases. (A) Comparison of ADGRG6 protein expression between PAAD tissues (n = 137) and normal pancreatic tissues (n = 74) using the UALCAN database (CPTAC dataset). (B–L) Subgroup analyses of ADGRG6 protein expression stratified by sex (B), chromatin modifier alteration status (C), age (D), weight (E), tumor grade (F), tumor stage (G), MYC/MYCN alteration (H), SWI/SNF complex alteration (I), and activity status of the mTOR (J), Hippo (K), and RTK (L) signal pathways. Each subgroup was compared to normal tissues. The “others” group in (C,H–L) refers to patients without the specific mutation or alteration listed. (M) Representative IHC staining images from the HPA database showing ADGRG6 expression in normal pancreatic tissue and PAAD tissue. Scale Bar: 200 µm. Data are presented as Mean ± SD. Statistical analysis was performed using Student’s t-test for two-group comparisons and one-way ANOVA followed by Bonferroni’s post hoc test. “*” indicates comparison with the control group; “#” indicates significance between experimental groups (* p < 0.05, *** p < 0.001; #p < 0.05).
Acknowledgments
This image is the copyrighted work of the attributed author or publisher, and
ZFIN has permission only to display this image to its users.
Additional permissions should be obtained from the applicable author or publisher of the image.
Full text @ Curr. Iss. Mol. Biol.
Your Input Welcome
Thank you for submitting comments. Your input has been emailed to ZFIN curators who may contact you if
additional information is required.
Oops. Something went wrong. Please try again later.