
IMAGE
FIGURE 2
- ID
- ZDB-IMAGE-260129-37
- Genes
- Publication
- Han et al., 2026 - Multiple susceptibility enhancer variants increasing ADD3 expression predisposes to biliary atresia risk
- All Figures
- Figures for Han et al., 2026
Image
|
Figure Caption
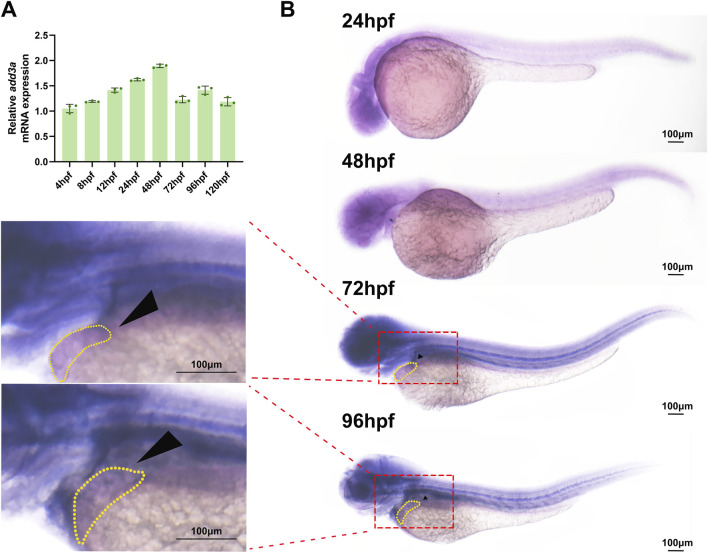
FIGURE 2
Spatiotemporal expression patterns of
Figure Data
Acknowledgments
This image is the copyrighted work of the attributed author or publisher, and
ZFIN has permission only to display this image to its users.
Additional permissions should be obtained from the applicable author or publisher of the image.
Full text @ Front Genet