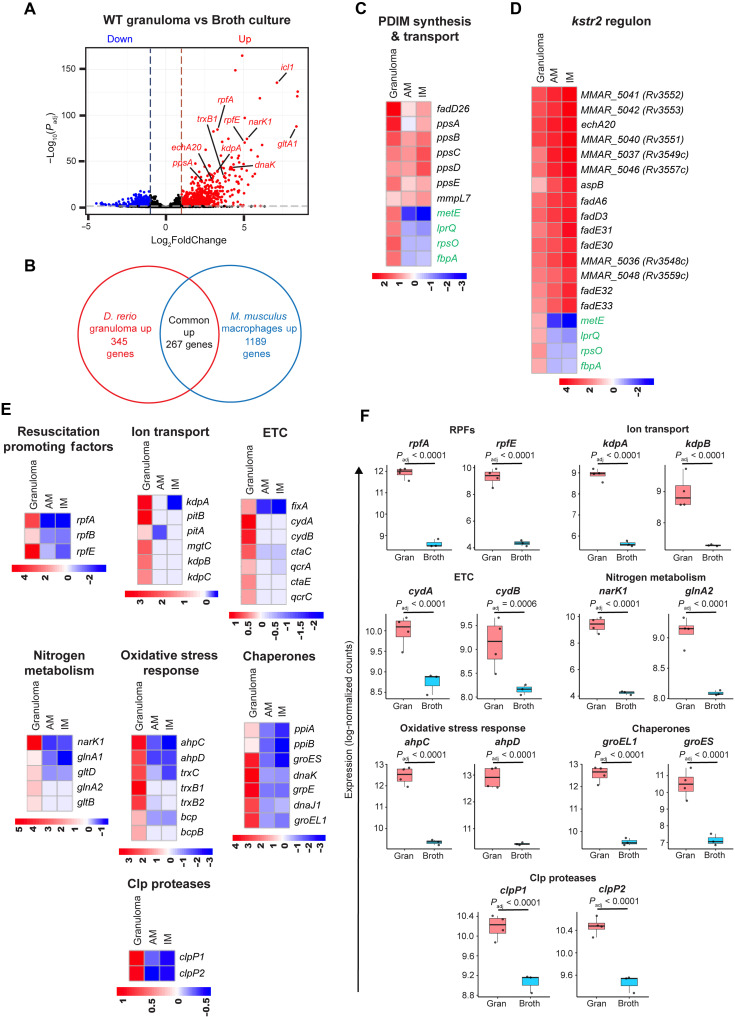
(A) Volcano plot showing the differential expression of M. marinum genes in WT granulomas versus broth culture. The horizontal dotted line indicates a Padj threshold of 0.1, whereas the vertical dotted lines represent log2 fold change thresholds of −1 and 1, respectively. (B) Venn diagram comparing up-regulated mycobacterial genes from necrotic granulomas in zebrafish with previously published data from in vivo mouse macrophages. (C and D) Heatmaps showing mycobacterial genes commonly up-regulated in zebrafish necrotic granulomas and in vivo mouse macrophages, related to PDIM synthesis and transport, and cholesterol catabolism. AM, alveolar macrophages; IM, interstitial macrophages. Four randomly selected genes specifically up-regulated in necrotic granulomas (colored green) were included to improve scaling and avoid skewed representation. (E) Heatmaps showing mycobacterial genes specifically up-regulated in zebrafish necrotic granulomas versus in vivo mouse macrophages, related to resuscitation promoting factors, ion transport, electron transport chain, nitrogen metabolism, oxidative stress response, chaperones, and Clp proteases. (F) Box plots showing the median log-normalized counts of representative transcripts from (E) in WT granulomas and broth culture. Each data point represents the log-normalized count of the respective transcript from an individual experiment. Benjamini-Hochberg (BH) correction was used to determine the adjusted P values.
Acknowledgments
This image is the copyrighted work of the attributed author or publisher, and
ZFIN has permission only to display this image to its users.
Additional permissions should be obtained from the applicable author or publisher of the image.
Full text @ Sci Adv
Your Input Welcome
Thank you for submitting comments. Your input has been emailed to ZFIN curators who may contact you if
additional information is required.
Oops. Something went wrong. Please try again later.