
|
FIGURE 7
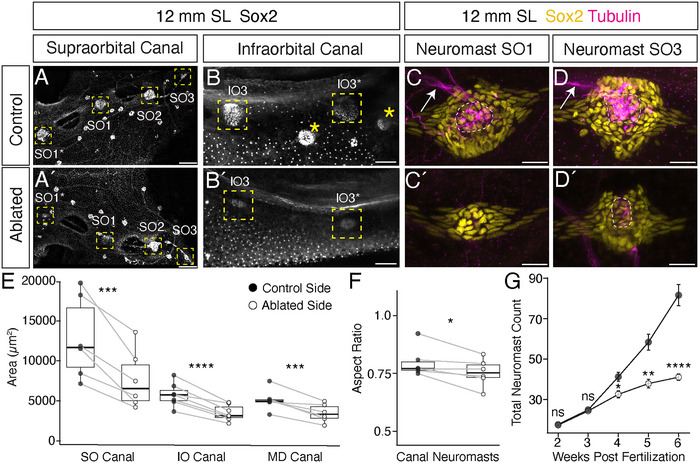
Loss of innervation disrupts canal neuromast size and morphology. (A–D′) Comparison of canal neuromasts on the control and ablated sides of a 12 mm specimen, immunolabeled with Sox2 (white, yellow) and acetylated alpha‐tubulin (magenta). (A, A′) dorsal view of canal neuromasts SO1*‐SO3 (yellow boxes). (B, B′) Lateral view of canal neuromasts IO2 and IO3 in the same specimen; yellow boxes indicate canal neuromasts, yellow asterisks indicate superficial neuromasts. Scale = 50 µm. (C, C′) Dorsal high magnification views showing morphology of canal neuromast SO1 on unablated control (C) versus ablated side (C′). (D, D′) Dorsal high magnification views showing morphology of neuromast SO3 on unablated control (D) versus ablated side (D′). Scale = 20 µm. (E‐F) Quantifications of canal neuromast area and aspect ratio. Gray lines indicate paired values. (E) Dot plot showing the difference in average canal neuromast area for the supraorbital (