IMAGE

Figure 1

ID
ZDB-IMAGE-260123-22
Source
Figures for Wang et al., 2026
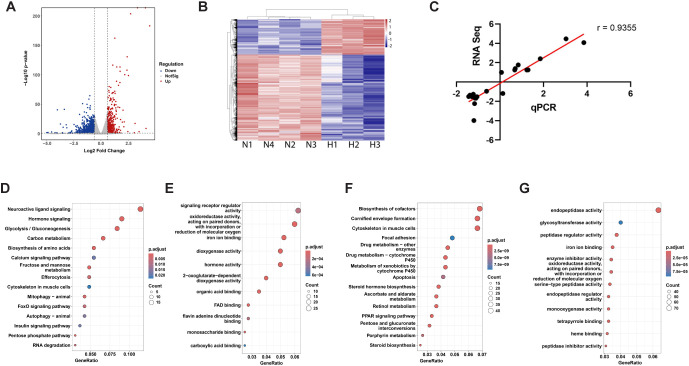
Image
Figure Caption

Figure 1

RNA-seq analysis of hypoxia-treated and normoxia control zebrafish. (A) Volcano plot of differentially expressed genes (DEGs) between hypoxia and normoxia groups. Significance on y-axis as -log10 (p-value) and effect size on x-axis as log2 (fold change). Dotted lines represent cutoffs of adjusted p-value < 0.05 and |log2(fold change)| > 0.6. Up-regulated genes under hypoxia are shown in red, down-regulated in blue, and non-significant change genes in gray. (B) Hierarchical clustering of the DEGs in the normoxia (N) and hypoxia (H) groups. Rows represent individual genes, and columns represent biological replicates from hypoxia and normoxia groups. Gene expression values were normalized and scaled by row (z-scores), with red indicating higher expression and blue indicating lower expression relative to the mean. (C) qRT-PCR confirmation of RNA-seq data. Changes (log2) in the mRNA levels of the 20 genes measured by RNA-seq were plotted against those detected by qPCR. The line indicates the linear correlation between the results of RNA-seq and qPCR. (D, F) KEGG pathway enrichment for up-regulated (D) and down-regulated (F) DEGs. (E, G) GO molecular function enrichment analysis for up-regulated (E) and down-regulated (G) DEGs. Dot size indicates the number of genes mapped to each term, and dot color reflects the statistical significance (adjusted p-value).

Acknowledgments
This image is the copyrighted work of the attributed author or publisher, and ZFIN has permission only to display this image to its users. Additional permissions should be obtained from the applicable author or publisher of the image. Full text @ Front Endocrinol (Lausanne)