
Image
|
Figure Caption
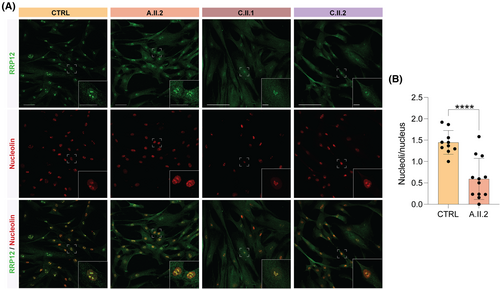
Fig. 3 Colocalization of RRP12 and nucleolar markers. (A) Representative immunofluorescence of RRP12 (green) and nucleolin (red) in the control and affected samples. Nucleolar structures are less defined and morphologically disrupted in patients' fibroblasts (A.II.2, C.II.1, C.II.2) compared to the control. Scale bar: 50 and 25 μm. (B) Quantification of number of nucleoli per cell in proband A.II.2 compared to control (P = <0.0001). *P ≤ 0.05; **P ≤ 0.01; ***P ≤ 0.001.
Acknowledgments
This image is the copyrighted work of the attributed author or publisher, and
ZFIN has permission only to display this image to its users.
Additional permissions should be obtained from the applicable author or publisher of the image.
Full text @ Mov. Disord.