
|
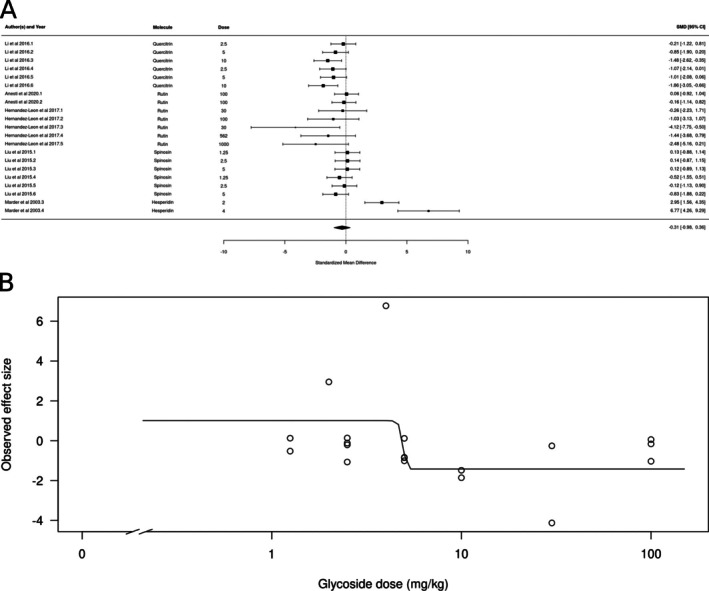
FIGURE 8
Subgroup analysis for glycoside derivatives. (A) Forest plot showing the results of 24 comparisons examining the effect of a glycoside derivative on anxiety‐like behavior in animal tests. The figure shows the standardized mean difference (SMD) between control and glycoside derivative‐treated groups with corresponding 95% confidence intervals in the individual comparison, based on a random‐effects model. A negative standardized mean difference (SMD) corresponds to decreased anxiety‐like behavior, while a positive SMD corresponds to increased anxiety‐like behavior after glycoside derivative treatment. The overall effect size is denoted by the diamond symbol. (B) Estimated dose–response curve, based on the observed effect size (SMD) with increasing glycoside derivative dose. Each point corresponds to a single comparison from the forest plot. The curve was obtained by fitting generalized log‐logistic 5‐parameter models, with dose as the independent variable and observed effect size SMD as the dependent variable.