IMAGE

Figure 2

ID
ZDB-IMAGE-260111-43
Source
Figures for Xie et al., 2025
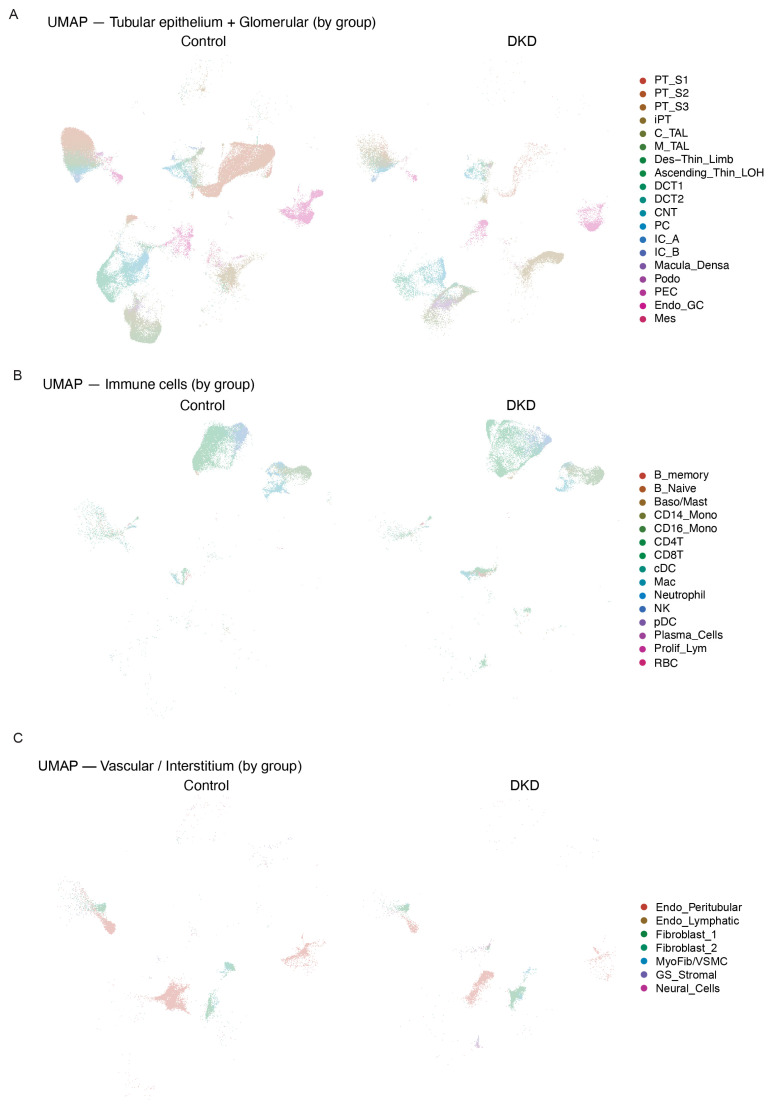
Image
Figure Caption

Figure 2

Single-cell transcriptomic atlas reveals cellular heterogeneity and disease-specific distribution patterns in control and DKD kidneys: (A) UMAP visualization of tubular epithelial and glomerular cell transcriptomes stratified by disease status (Control vs. DKD). The plot displays the distribution of cell populations in both conditions, with specific cell types annotated including segments of the proximal tubule, loop of Henle, distal tubule, collecting duct, podocytes, parietal epithelial cells, mesangial cells, and endothelial cells within the glomerulus. DKD samples show enrichment of injured proximal tubule cells (iPT) and altered cellular composition compared to controls. (B) UMAP visualization of immune cell transcriptomes in control and DKD kidneys. The plot shows the distribution of various immune cell populations including T cells (CD4+ and CD8+), B cells (naive, memory, and plasma cells), monocytes/macrophages (CD14+ Mono, CD16+ Mono, Mac), neutrophils, NK cells, dendritic cells (cDC, pDC), and proliferating lymphocytes. DKD kidneys exhibit increased monocyte/macrophage infiltration and altered immune cell composition. (C) UMAP visualization of vascular and interstitial cell transcriptomes in control and DKD conditions. The plot displays the distribution of non-immune, non-epithelial stromal populations including peritubular and lymphatic endothelial cells, fibroblast subtypes (Fibroblast_1, Fibroblast_2), myofibroblasts/vascular smooth muscle cells (MyoFib/VSMC), glomerular stromal cells (GS_Stromal), and neural cells.

Acknowledgments
This image is the copyrighted work of the attributed author or publisher, and ZFIN has permission only to display this image to its users. Additional permissions should be obtained from the applicable author or publisher of the image. Full text @ Int. J. Mol. Sci.