
FIGURE 1
- ID
- ZDB-IMAGE-260105-66
- Publication
- Tseng et al., 2025 - Disruption of Swell1/VRAC function impairs initial hemodynamics and activates compensatory leukotriene signaling in zebrafish circulation development
- All Figures
- Figures for Tseng et al., 2025
|
FIGURE 1
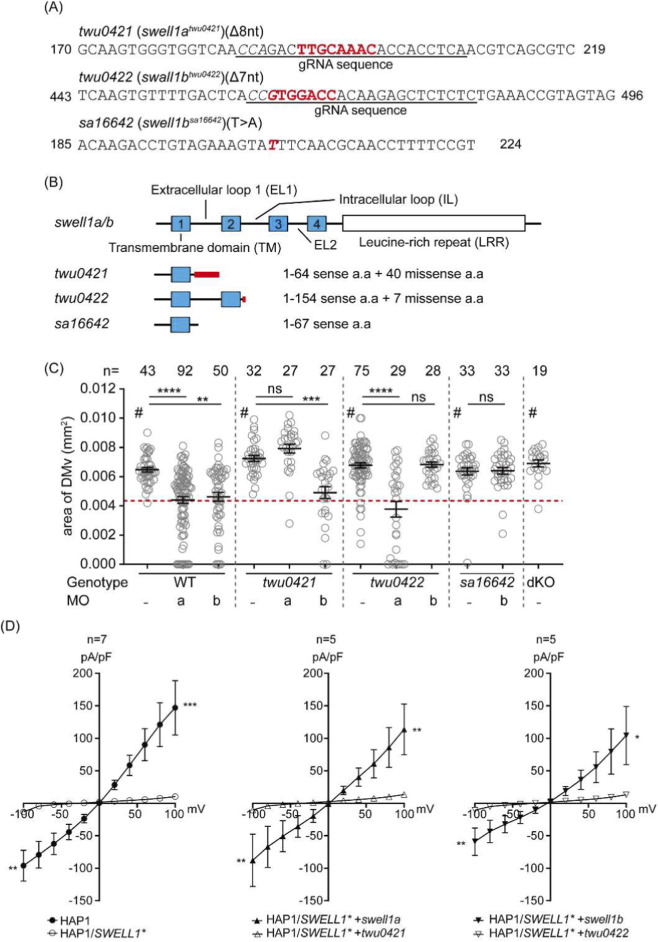
VSOAC deficiency in