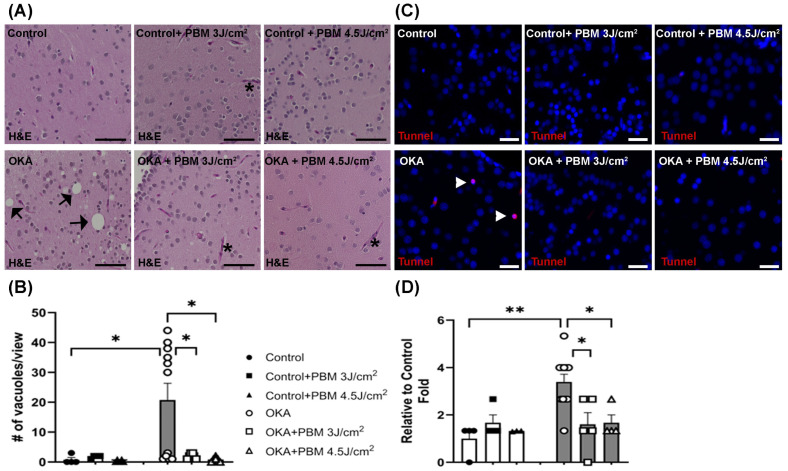
Hematoxylin and Eosin (H&E) and TUNEL staining of zebrafish brain sections. (A) Shown are representative brain sections of control and treated zebrafish, where some vacuoles and blood vessels are indicated by black arrows and asterisks, respectively. Scale bars: 50 μm. (B) The mean number of vacuoles per view. * p < 0.05. (C) Shown is TUNEL staining of representative brain sections of control and treated zebrafish, where some apoptotic cells (red) are labeled by white arrowheads. Cell nuclei were counterstained with Hoechst 33342 (blue). Scale bars: 20 μm. (D) The fold changes in apoptotic cells relative to the untreated control group. The bar graphs show means ± s.e.m while open and solid signs display individual data points for the indicated groups. * p < 0.05 and ** p < 0.01.
This image is the copyrighted work of the attributed author or publisher, and
ZFIN has permission only to display this image to its users.
Additional permissions should be obtained from the applicable author or publisher of the image.
Full text @ Biomedicines
Your Input Welcome
Thank you for submitting comments. Your input has been emailed to ZFIN curators who may contact you if
additional information is required.
Oops. Something went wrong. Please try again later.