IMAGE

Figure 2

ID
ZDB-IMAGE-260101-63
Source
Figures for Eroglu et al., 2025
Image
Figure Caption

Figure 2

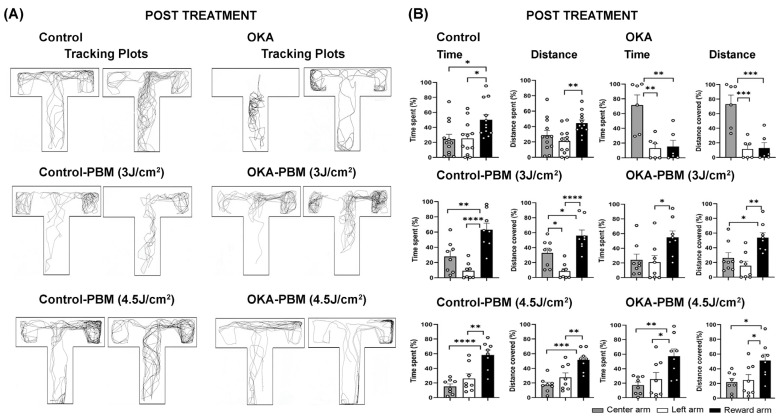
Behavioral response of zebrafish to OKA and PBM treatments on Day 10. (A) Representative tracking plots (two examples per group) showing the behavior of zebrafish in each group. (B) Quantification of the recorded tracking plots showing time spent and distance covered in each zone as percentages. The shaded, open, and solid black columns represent the central long arm, left arm, and right (reward) arm, respectively, as indicated by the color-coded zones in Figure 1D. The bar graphs show means ± s.e.m while open circles display individual data points. * p < 0.05, ** p < 0.01, *** p < 0.001, and **** p < 0.0001.

Figure Data
Acknowledgments
This image is the copyrighted work of the attributed author or publisher, and ZFIN has permission only to display this image to its users. Additional permissions should be obtained from the applicable author or publisher of the image. Full text @ Biomedicines