
IMAGE
Fig. 4.
- ID
- ZDB-IMAGE-260101-58
- Publication
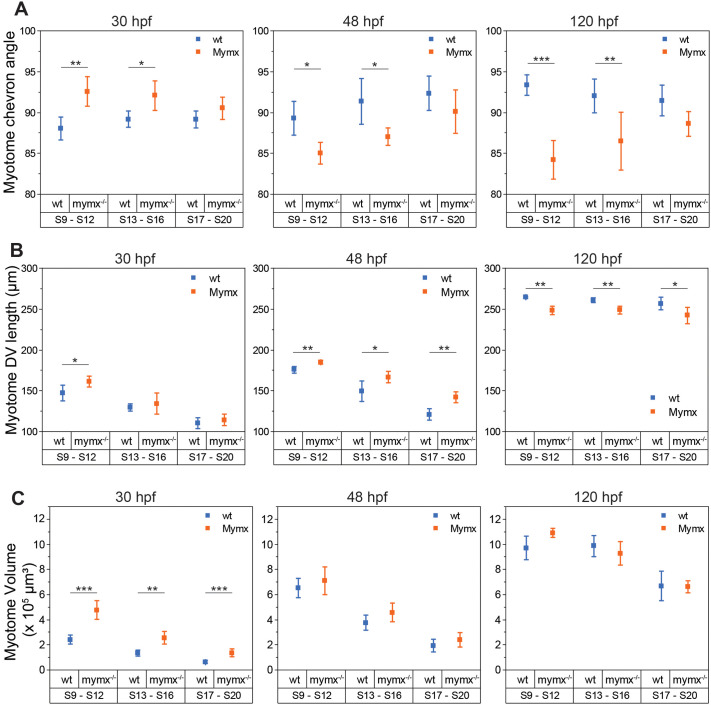
- Dhar et al., 2025 - Dynamic expression and differential requirement of the myocyte fusogen Myomixer during distinct myogenic episodes in the zebrafish
- All Figures
- Figures for Dhar et al., 2025
Image
|
Figure Caption
Fig. 4.
Figure Data
Acknowledgments
This image is the copyrighted work of the attributed author or publisher, and
ZFIN has permission only to display this image to its users.
Additional permissions should be obtained from the applicable author or publisher of the image.
Full text @ Biol. Open