
Image
|
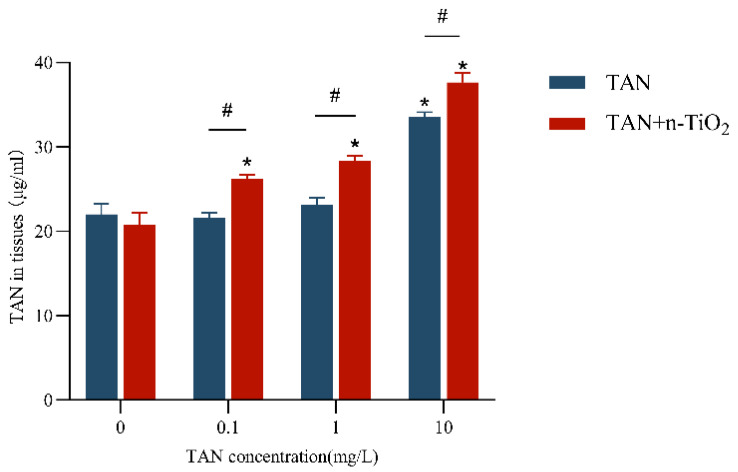
Figure Caption
Figure 4
TAN content in zebrafish larvae following 120 h exposure. Quantification of total ammonia nitrogen accumulation in larval tissues after exposure to control, TAN alone (0.1, 1, 10 mg/L), n-TiO2 alone (100 µg/L), and co-exposure treatments. Data are presented as mean ± SEM (n = 3 biological replicates). *
Acknowledgments
This image is the copyrighted work of the attributed author or publisher, and
ZFIN has permission only to display this image to its users.
Additional permissions should be obtained from the applicable author or publisher of the image.
Full text @ Toxics