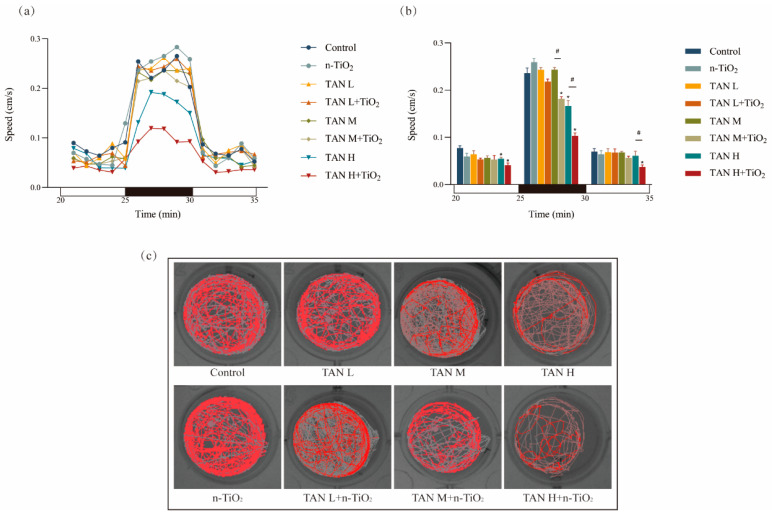
Locomotor behavior analysis of 120 hpf zebrafish larvae following 120 h exposure to TAN and n-TiO2: (a) mean swimming velocity (cm/s) recorded at 60-s intervals during light–dark transition stimulation. The horizontal axis shows dark phases (black bars, 25–30 min) and light phases (white bars, 20–25 min and 30–35 min); (b) average swimming speed (cm/s) calculated per 5 min photoperiod interval, summarizing locomotor activity during each light or dark phase; (c) representative movement trajectories of larvae during the dark phase (red curve); * indicates significant differences between the control and exposed groups (p < 0.05); # indicates significant difference between TAN and n-TiO2 + TAN treatments (p < 0.05). Note: TAN L: low-concentration TAN; TAN M: medium-concentration TAN; TAN H: high-concentration TAN.
Acknowledgments
This image is the copyrighted work of the attributed author or publisher, and
ZFIN has permission only to display this image to its users.
Additional permissions should be obtained from the applicable author or publisher of the image.
Full text @ Toxics
Your Input Welcome
Thank you for submitting comments. Your input has been emailed to ZFIN curators who may contact you if
additional information is required.
Oops. Something went wrong. Please try again later.