IMAGE

Figure 2

ID
ZDB-IMAGE-251225-6
Source
Figures for Lyu et al., 2025
Image
Figure Caption

Figure 2

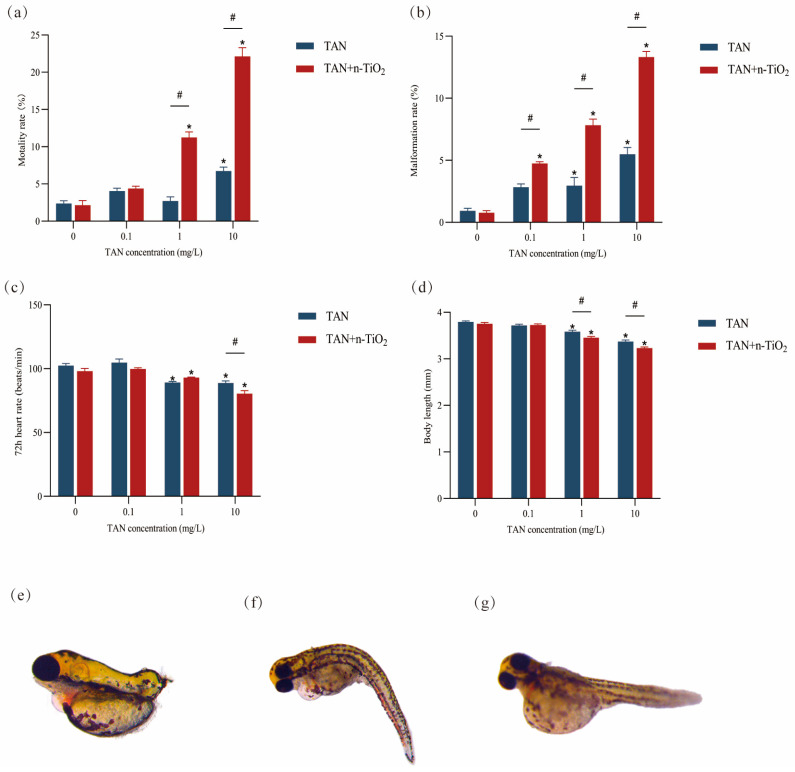
Zebrafish embryonic developmental endpoints and representative morphological malformations at 120 hpf: (a) mortality rate (%); (b) malformation rate (%); (c) heart rate (beats/min); (d) body length (mm); (e) representative image showing tail hypoplasia; (f) representative image showing spinal curvature; (g) representative image showing yolk sac edema. Data are presented as mean ± SEM (n = 3 independent experiments). Statistical significance was determined by one-way ANOVA with Tukey’s post hoc test. * indicates significant difference between control and exposed groups (p < 0.05); # indicates significant difference between TAN and n-TiO2 + TAN treatments (p < 0.05).

Acknowledgments
This image is the copyrighted work of the attributed author or publisher, and ZFIN has permission only to display this image to its users. Additional permissions should be obtained from the applicable author or publisher of the image. Full text @ Toxics