
IMAGE
Figure 6
- ID
- ZDB-IMAGE-251225-47
- Publication
- Drepper et al., 2025 - Hyperactivity and Differential Gene Expression in lbx1a(-/-) Zebrafish Larvae
- All Figures
- Figures for Drepper et al., 2025
Image
|
Figure Caption
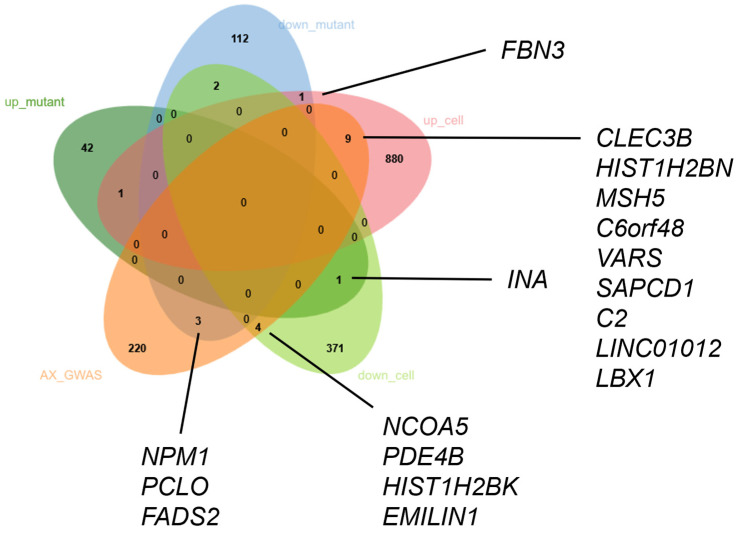
Figure 6
The combined analysis of differentially expressed genes in both experimental set-ups. A Venn diagram showing the amount of overlap of the downregulated genes in
Acknowledgments
This image is the copyrighted work of the attributed author or publisher, and
ZFIN has permission only to display this image to its users.
Additional permissions should be obtained from the applicable author or publisher of the image.
Full text @ Cells