
Image
|
Figure Caption
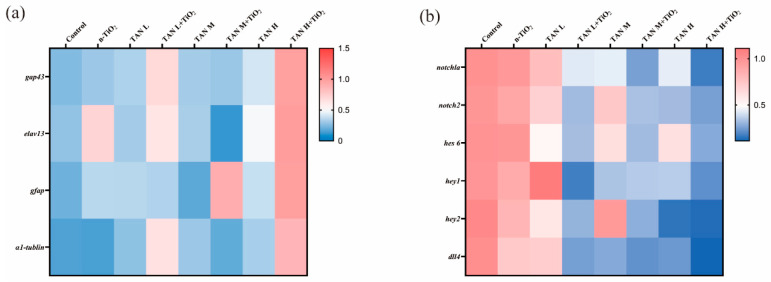
Figure 9
Analysis of neural development and Notch pathway gene expression in zebrafish larvae after 120 h exposure: (
Acknowledgments
This image is the copyrighted work of the attributed author or publisher, and
ZFIN has permission only to display this image to its users.
Additional permissions should be obtained from the applicable author or publisher of the image.
Full text @ Toxics