
Fig. 2
- ID
- ZDB-IMAGE-251218-19
- Genes
- Publication
- Le Bleu et al., 2025 - Voltage-gated calcium channels generate blastema Ca2+ fluxes restraining zebrafish fin regenerative outgrowth
- All Figures
- Figures for Le Bleu et al., 2025
|
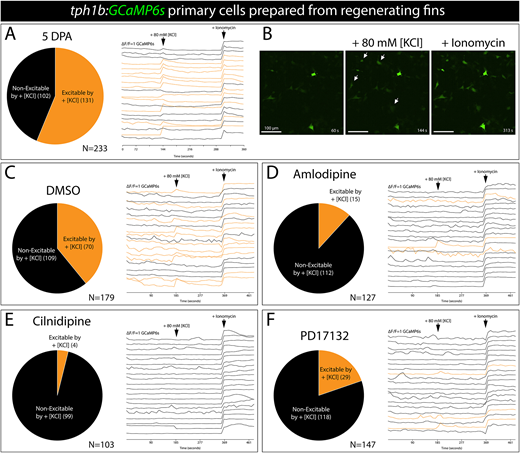
Fig. 2 Voltage-gated Ca2+ channels produce Ca2+ fluxes upon membrane depolarization of fibroblast-lineage fin cells. (A,B) Fibroblast-lineage blastemal mesenchymal cells flux Ca2+ in response to depolarization. Primary cells were prepared from 5 day post amputation (dpa) regenerating caudal fins pooled from tph1b:GCaMP6s adult fish. (A) The pie chart indicates the fraction of tph1b:GCaMP6s-expressing primary cells excited by addition of 80 mM KCl at 144 seconds (s). Treatment with the calcium ionophore ionomycin at 313 s demonstrates each cell's maximum GCaMP6s signal. The neighboring plot shows normalized GCaMP6s intensity traces for 20 randomly selected KCl-responsive cells. (B) Representative time-lapse confocal images showing Ca2+ spikes at 144 s (+ 80 mM KCl) and 313 s (+ ionomycin). White arrows indicate select Ca2+-responsive cells. Scale bars: 100 µm. (C-F) L- and N-type voltage-gated Ca2+ channels enable calcium fluxes upon membrane depolarization of regenerating fin cells. Pie charts indicate the fraction of excitable cells upon DMSO (C; control), 500 nM amlodipine (D; L-type inhibitor), 500 nM cilnidipine (E, N- and L-type inhibitor) and 500 nM PD17132 (F, N-type inhibitor) treatment from a representative experiment (twice repeated with the full set of inhibitors). The adjacent plots show normalized GCaMP6s intensity traces corresponding to 20 randomly selected cells. Individual Ca2+ traces indicate KCl-responsive (orange) and non-responsive (black) cells.