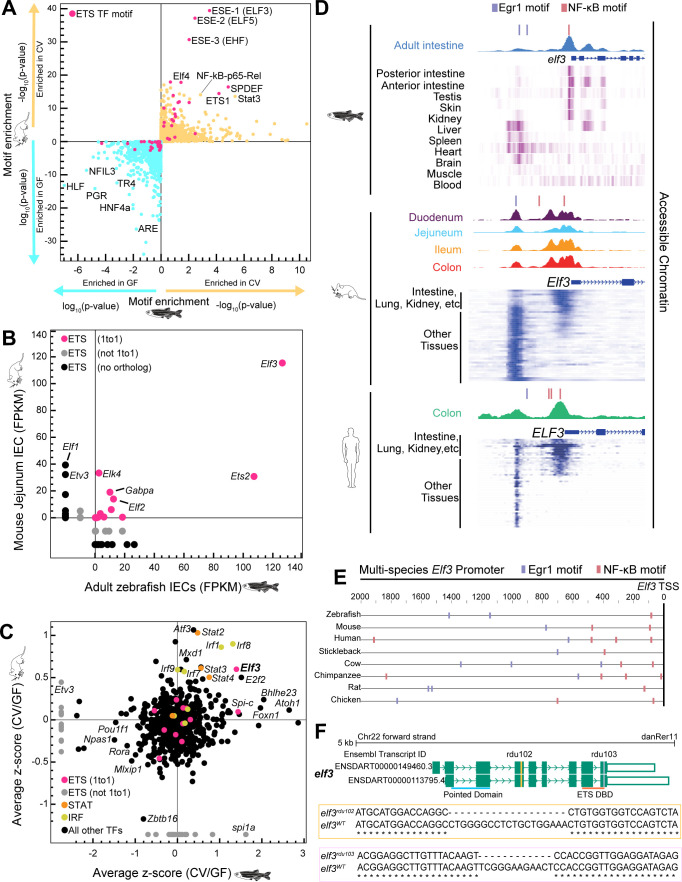
Identification of a candidate TF mediating conserved host responses to the microbiota. (A) TFBM enrichment as assessed by default Hypergeometric Optimization of Motif EnRichment (HOMER) software (47) near genes microbially responsive in mouse (y-axis) and zebrafish (x-axis) digestive tissue. The log10(P-value) (GF/CV) and −log10(P-value) (CV/GF) are plotted for motif enrichment. Both comparisons are plotted on each axis for mouse (y-axis) and zebrafish (x-axis) and are differentiated by the blue and yellow arrows. (B) mRNA expression of ETS transcription factors in mouse and zebrafish IECs represented as fragments per kilobase of transcript per million (FPKM) mapped reads. The orthologous relationships between each ETS TF in zebrafish and mice are indicated by the pink (one to one), gray (not one to one), and black (no ortholog) colored data points. (C) Average z-scored mRNA levels of genes significantly differential in CV/GF comparisons across multiple mouse and zebrafish studies. (D) Visualization of accessible chromatin peaks within the elf3 promoter of zebrafish (45), mouse (46), and human (45) IECs. Below the accessible chromatin peaks for each species are heatmaps of ATAC-seq performed in diverse zebrafish (51), mouse (52), and human (52) tissue types (visualized via the WashU genome browser [53]). For the mouse and human data sets, more epithelial tissues like the intestine and lung are grouped compared to other tissue types. (E) Comparison of the elf3 promoter across diverse vertebrate species with the location of the conserved Erg1 and NF-κB motifs depicted by the blue and pink boxes, respectively. The vertebrates featured in this analysis include zebrafish (Danio rerio), mouse (Mus musculus), human (Homo sapiens), stickleback (Gasterosteus aculeatus), cow (Bos taurus), chimpanzee (Pan troglodytes), rat (Rattus norvegicus), and chicken (Gallus gallus). (F) Schematic of the protein coding elf3 isoforms in zebrafish derived from the UCSC genome browser (GRCz11/danRer11). Exons are colored green, and introns are depicted as green arrows. The yellow and pink vertical lines indicate the location of the rdu102 and rdu103 CRISPR lesions, respectively. The horizontal lines at the bottom of the schematic indicate the location of the SMART-predicted functional domains (54, 55), Pointed (blue) and ETS DNA-binding (orange).
Acknowledgments
This image is the copyrighted work of the attributed author or publisher, and
ZFIN has permission only to display this image to its users.
Additional permissions should be obtained from the applicable author or publisher of the image.
Full text @ MBio
Your Input Welcome
Thank you for submitting comments. Your input has been emailed to ZFIN curators who may contact you if
additional information is required.
Oops. Something went wrong. Please try again later.