
|
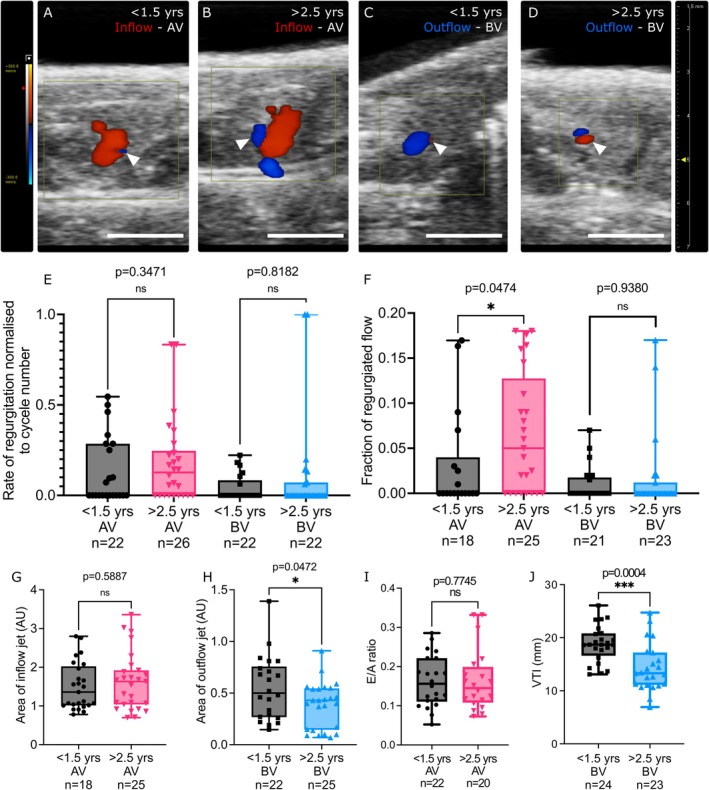
FIGURE 6
Functional changes in aged zebrafish hearts. (A–D) Example images from colour Doppler analysis revealing the inflow of blood through the AV (red—A, B) and outflow of blood through the BV (blue—C, D) in young (A, C) and aged zebrafish (B, D). Regurgitation is indicated by the opposite colour at the same anatomical region (white arrowheads in A–D). Anterior is to the left. (E, F) Quantification of the rate of regurgitation, normalised to cycle number (E) and the fraction of the regurgitated flow (F) observed at the AV and BV of young and aged zebrafish. (G, H) Area measurements of the maximal flow through the AV (G) and BV (H) in young and aged zebrafish. AU, arbitrary units. (I, J) Quantification of functional parameters of the AV (I) and BV (J) of young and aged zebrafish via pulse wave Doppler echocardiography. Statistical analysis: E, F, G, I = Mann Whitney‐