IMAGE

FIGURE 5

ID
ZDB-IMAGE-251210-30
Source
Figures for Bevan et al., 2025
Image
Figure Caption

FIGURE 5

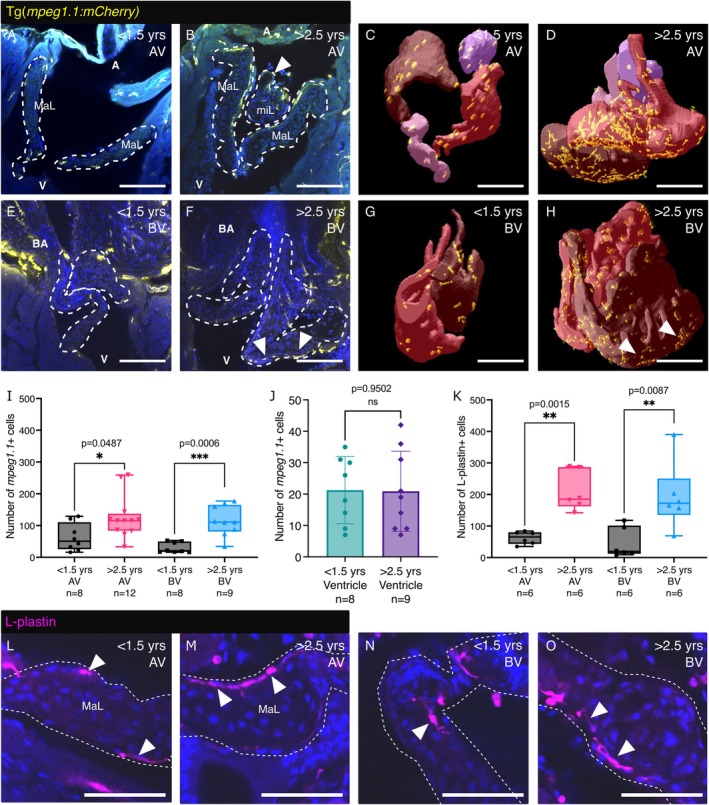
Changes in immune cell number in aged zebrafish valves. (A–D) Images (A, B) and 3D renders (C, D) of the cleared AV from young (A, C) and aged (B, D) Tg(mpeg1.1:mCherry) zebrafish. (E–H) Images (E, F) and 3D renders (G, H) of the cleared BV from young (E, G) and aged (F, H) Tg(mpeg1.1:mCherry) transgenic zebrafish. White arrowheads indicate macrophages close to cystic regions of the BV in aged zebrafish. (I) Quantification of the number of mpeg1.1+ cells associated with the entire AV (left) and BV (right) of young and aged Tg(mpeg1.1:mCherry) transgenic zebrafish. (J) Quantification of the number of mpeg1.1+ cells in a 200 μm3 region of the ventricle (away from the valve) in young and aged Tg(mpeg1.1:mCherry) zebrafish. (K) Quantification of the number of L‐plastin+ leukocytes in the AV (left) and BV (right) of young and aged zebrafish. (L–O) Confocal images of cleared valves labelled with an anti‐L‐plastin antibody. Leukocytes can be seen on the surface of all leaflets (arrowheads). Individual leaflets are outlined with white dashed lines in A, B, E, F, L–O. A, atrium; BA, Bulbus arteriosus; MaL, major leaflets; miL, minor leaflets; V, ventricle. Statistical analysis: I, K(BV) = Mann–Whitney tests; J, K(AV) = Welch's t test. Scale bars: A–H = 100 μm; M–P = 50 μm.

Acknowledgments
This image is the copyrighted work of the attributed author or publisher, and ZFIN has permission only to display this image to its users. Additional permissions should be obtained from the applicable author or publisher of the image. Full text @ Aging Cell