
|
FIGURE 4
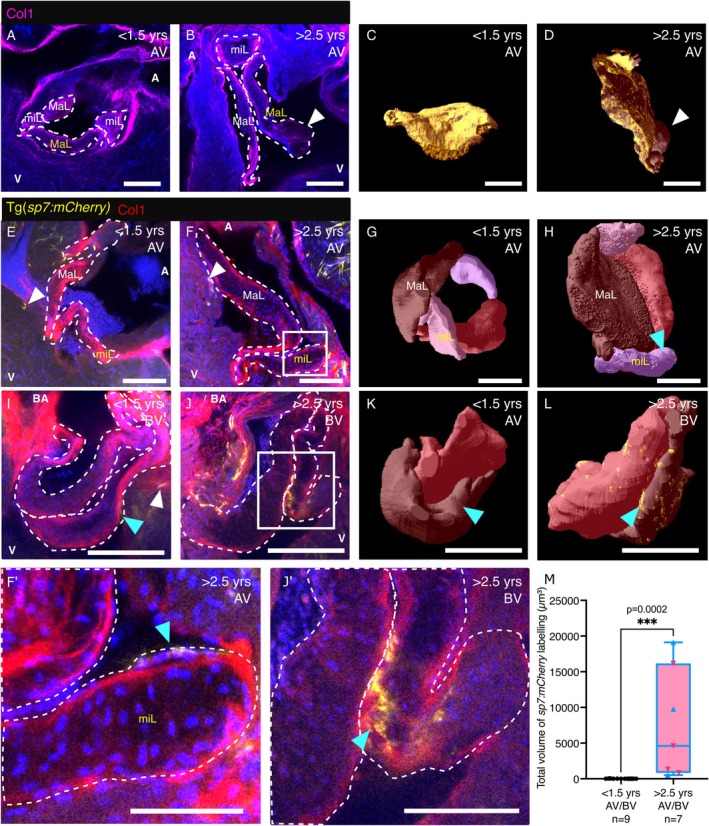
Collagen distribution and osteoblastic differentiation in young and aged zebrafish valves. (A–D) Images of cleared AVs (A, B) and 3D renders of a single leaflet (C, D) from young (A, C) and aged (B, D) zebrafish, labelled with an anti‐Collagen I antibody. The major leaflet (MaL) shown in C, D is marked in yellow on A, B, respectively. White arrowheads in B, D indicate cystic regions devoid of collagen. (E–H) Images (E, F, higher magnification in F′) and 3D renders (G, H) of the cleared AV labelled with an anti‐Collagen I antibody from young (E, G) and aged (F, H) Tg(