IMAGE

Figure 3

ID
ZDB-IMAGE-251208-82
Source
Figures for Martínez-Balsalobre et al., 2025
Image
Figure Caption

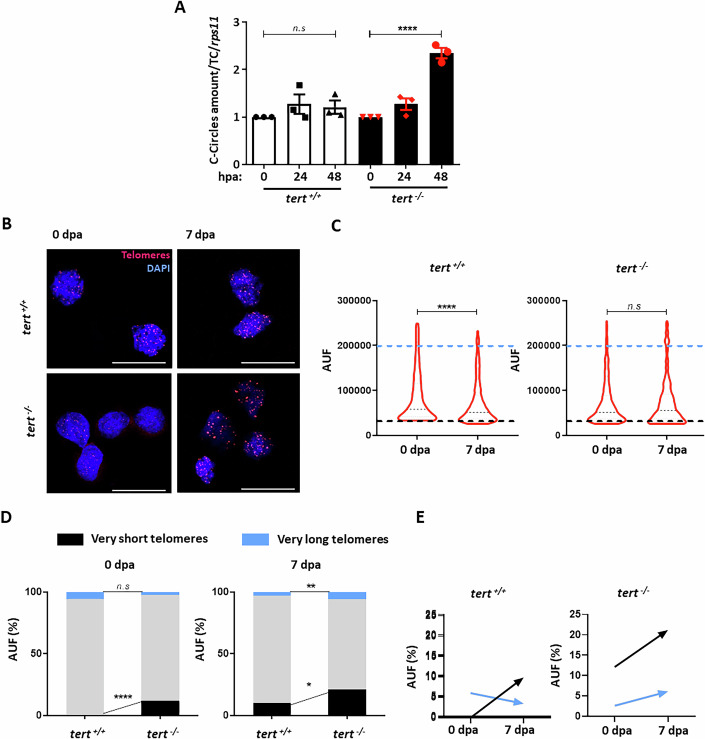
Figure 3 Telomerase deficient zebrafish exhibit C-circles and heterogeneous telomere length in regenerative tissue.

(A) C-circles abundance in regenerative tissue from wild type and telomerase-deficient adult zebrafish at 0, 24, and 48 hpa. n = 3 experiments. Each dot represents a biological replicate. (B) Representative images of Q-FISH in blastema cells from tert+/+ and tert−/− genotypes at time 0 dpa and 7 dpa. Red staining shows telomeres and blue represents nuclei staining. Scale bar, 16,3 μm. (C) Telomeric fluorescence values (arbitrary units of fluorescence, AUF) of regenerative cells from tert+/+ and tert−/− adult zebrafish at two times. n = 1000 cell events. (D) Telomeric fluorescence frequency of blastema cells from tert+/+ and tert−/− adult zebrafish at 0 dpa and 7 dpa. Very long telomeres have a higher fluorescence of 200,000 AUF, and very short telomeres have a lower fluorescence of 30,000 AUF. (E) Schematic representation of the behaviour of very long (blue arrow) and very short telomeres (black arrow) during fin regeneration of wild type and tert−/− fish. All data were mean + s.e.m. n.s. not significant. ****P < 0.0001 for, one-way ANOVA plus Dunnett’s post hoc test (A) and Student t-test (C, D). When exact p values are not indicated is because GraphPad Prism software does not show it. Source data are available online for this figure.

Acknowledgments
This image is the copyrighted work of the attributed author or publisher, and ZFIN has permission only to display this image to its users. Additional permissions should be obtained from the applicable author or publisher of the image. Full text @ EMBO Rep.