
|
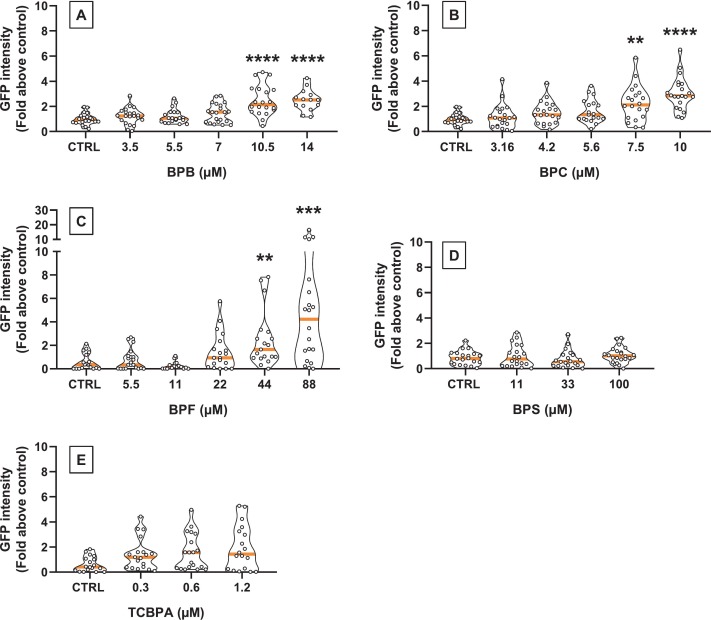
Fig. 9 Representative concentration-responses obtained in EMERGE for bisphenols. GFP expression in zebrafish embryos exposed to (A) bisphenol B (BPB); (B) bisphenol C (BPC); (C) bisphenol F (BPF); (D) bisphenol S (BPS); (E) tetrachlorobisphenol A (TCBPA). * denotes significant differences as compared to control DMSO 0.01 %; Kruskal Wallis test followed by Dunn’s test; P ≤ 0.01 (**), P ≤ 0.001 (***) and P ≤ 0.0001 (****). Data are represented as violon plot with each point representing fluorescent intensity in individual embryo, expressed as fold GFP intensity above control; solid lines represent the median of each test condition. Outliers (detected with GraphPad Prism: ROUT method with Q = 1 %) were removed. BPA is not represented as results varied across experiments. All independent experiments can be found in supplementary material.