
|
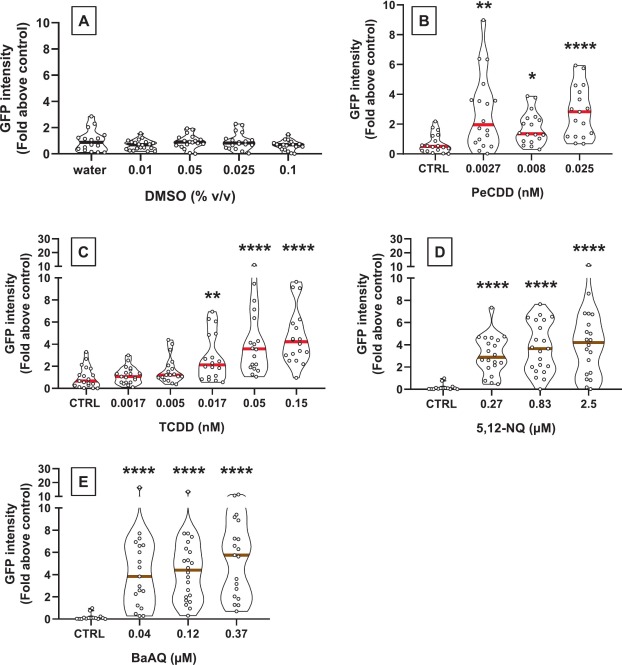
Fig. 8 Representative concentration-responses obtained in EMERGE for dioxins (B-C) and oxy-PAHs (D-E). GFP expression in zebrafish embryos exposed to (A) dimethylsufoxide (DMSO); (B) 1,2,3,7,8-pentachlorodibenzo-p-dioxin (PeCDD); (C) 2,3,7,8-tetrachlorodibenzo-p-dioxin (TCDD); (D) 5,12-Naphtacenequinone (5,12-NQ); (E) benz(a)anthracene-1,12-dione (BaAQ). * denotes significant differences as compared to control DMSO 0.01 %; Kruskal Wallis test followed by Dunn’s test; P ≤ 0.05 (*), P ≤ 0.01 (**) and P ≤ 0.0001 (****). Data are represented as violon plot with each point representing fluorescent intensity in individual embryo, expressed as fold GFP intensity above control; solid lines represent the median of each test condition. Outliers (detected with GraphPad Prism: ROUT method with Q = 1 %) were removed. All independent experiments can be found in supplementary material.