
Image
|
Figure Caption
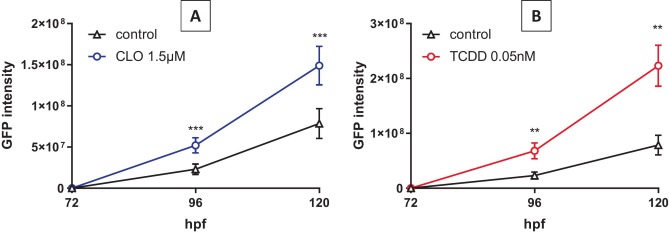
Fig. 4 Time-dependent effect of CLO and TCDD on GFP fluorescence intensity. GFP intensity was monitored in developing embryos (n = 24) exposed to (A) clotrimazole (CLO) 1.5 µM or (B) TCDD 0.05 nM from 72 hpf and observed at 72; 96 and 120 hpf. Same individuals are observed for each time point. Control condition corresponds to DMSO 0.01 %.
Acknowledgments
This image is the copyrighted work of the attributed author or publisher, and
ZFIN has permission only to display this image to its users.
Additional permissions should be obtained from the applicable author or publisher of the image.
Full text @ Environ. Int.