
|
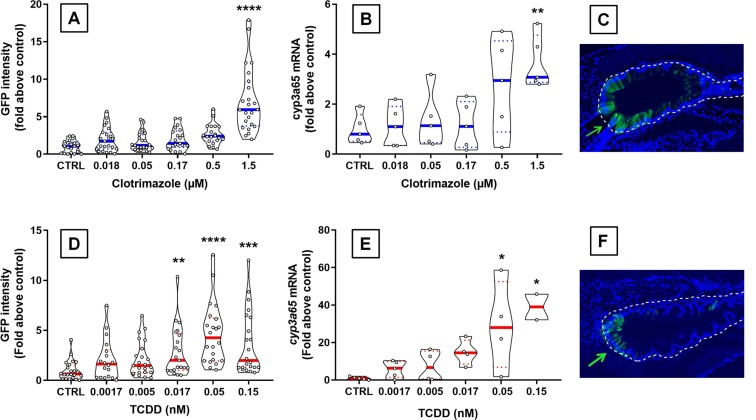
Fig. 3 Effect of CLO and TCDD on GFP fluorescence intensity and cyp3a65 mRNA expression. GFP intensity in individual embryos (n = 21 iembryos per condition minimum) at 120 hpf after 48 h exposure to (A) CLO and (D) TCDD (control: DMSO 0.01 %) and cyp3a65 mRNA expression in pooled zebrafish embryos (n = 5 embryos/pool) in (B) CLO and (E) TCDD. GFP immunohistochemistry staining (green) in the intestine after 48 h exposure to (C) CLO 1.5 µM and (F) TCDD 0.05 nM; blue: nucleus DNA staining). Green arrow shows GFP fluorescence in the intestine. Pictures were reworked in terms of contrast to highlight the GFP fluorescence signal. (For interpretation of the references to colour in this figure legend, the reader is referred to the web version of this article.)