
Image
|
Figure Caption
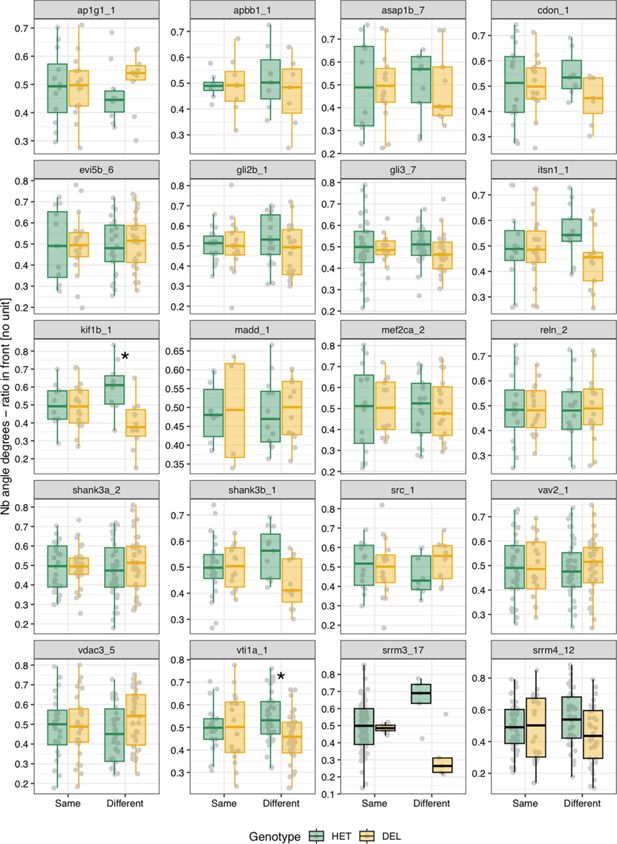
Fig. 5 - Supplemental 8 Ratio neighbor in front by genotype for each main microexon and regulator line. (A) Median ratio neighbor (nb) in front (from 0 to 1) for each fish over the 10' time course by pair type. ‘Same’ corresponds to either Het-Het or Del-Del pairs and ‘Different’ to Het-Del pairs. In both cases, each data point corresponds to an individual fish. None of the comparisons between Het and Del individuals were significant at a threshold of p<0.01 using Wilcoxon Rank-Sum tests.
Acknowledgments
This image is the copyrighted work of the attributed author or publisher, and
ZFIN has permission only to display this image to its users.
Additional permissions should be obtained from the applicable author or publisher of the image.
Full text @ Elife