
Image
|
Figure Caption
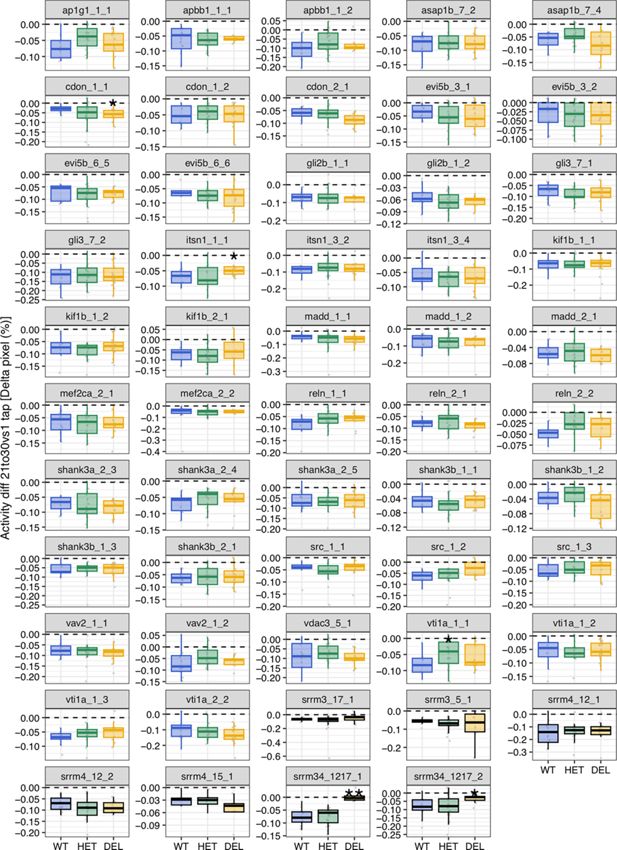
Fig. 4 - Supplemental 10 Difference in activity between the first tap and taps 21–30. Boxplots showing the change in activity in the first tap vs. taps 21–30 for each microexon and regulator deletion line and biological replicate (clutch). p-Values correspond to Wilcoxon Rank-Sum tests between WT and each of the other genotypes. * 0.05
Acknowledgments
This image is the copyrighted work of the attributed author or publisher, and
ZFIN has permission only to display this image to its users.
Additional permissions should be obtained from the applicable author or publisher of the image.
Full text @ Elife