
|
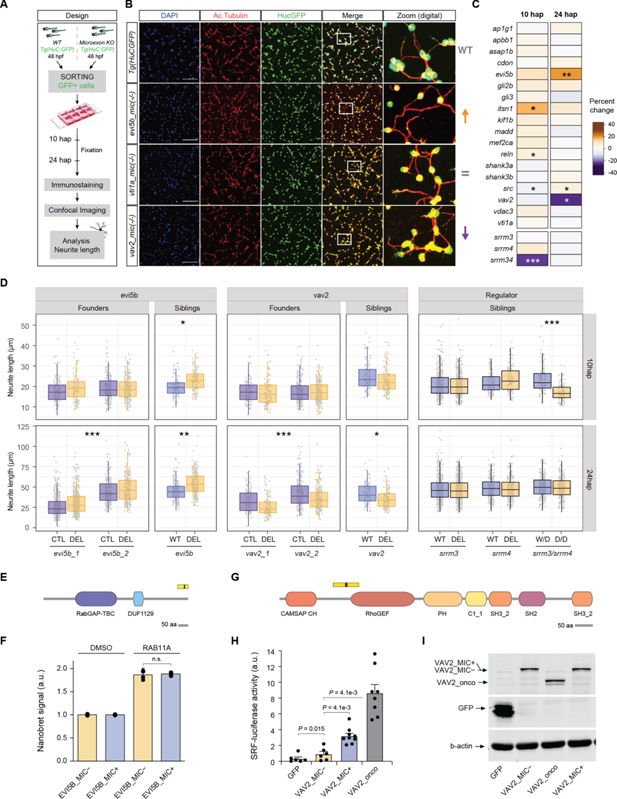
Fig. 3 Impact of microexon deletion on neurite outgrowth. (A) Schematic representation of the experimental design used to assess neurite outgrowth in zebrafish neuronal primary cultures (see Methods). (B) Confocal images of example microexon deletions at 24 hours post-plating (hap). ×20 magnification images, white squares indicate the zoom region amplified in the right panel (digital zoom). Scale bar 50 µm. (C) Heatmap showing the median percent of change in neurite length at 10 and 24 hap of the homozygous mutant with respect to the matched control neurons (HuC:GFP line) for each main microexon deletion line (data for all tested lines in Figure 3—figure supplement 2). Significance is based on the median of p-value distribution of 10,000 bootstrap resampling Wilcoxon tests for each main founder. * 0.01