
|
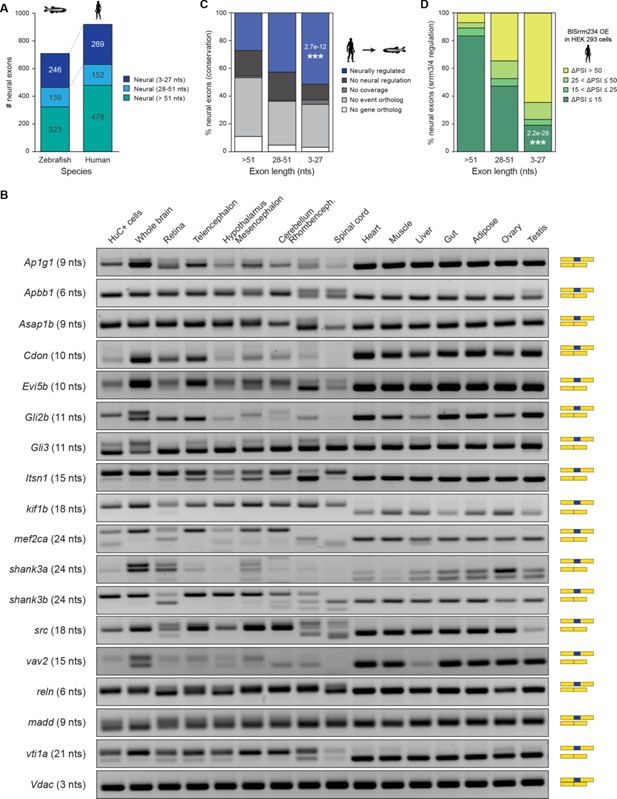
Fig. 1 - Supplemental 1 Identification and validation of neural microexons in zebrafish. (A) Distribution of neural exons in zebrafish and human according to their length group. (B) RT-PCR assays assessing the inclusion of 21 selected microexons across zebrafish tissues. Primer sequences are provided in Supplementary file 4. (C) Evolutionary conservation of human neural exons of different length group at the genomic and tissue-regulatory level compared with zebrafish. Exons conserved at the regulatory level (blue) are those with enriched inclusion in neural samples (ΔPSI ≥15) also in zebrafish. Those with no neural regulation (black) are conserved at the genomic level (Irimia et al., 2009), but are not neurally enriched. Those conserved but with insufficient coverage to assess regulation are indicated as ‘No coverage’ (dark grey). p-Value corresponds to a two-sided Fisher’s Exact test for neural conservation vs. others between exons >51 nts and 3–27 nts. (E) Distribution of exons of different length by the level of upregulation upon overexpression of the regulator in HEK cells (see Materials and methods). p-Value corresponds to a two-sided Fisher’s Exact test for non-regulated exons (ΔPSI ≤15) vs. others between exons >51 nts and 3–27 nts.