IMAGE

Figure 4

ID
ZDB-IMAGE-251127-61
Source
Figures for Dominik et al., 2025
Image
Figure Caption

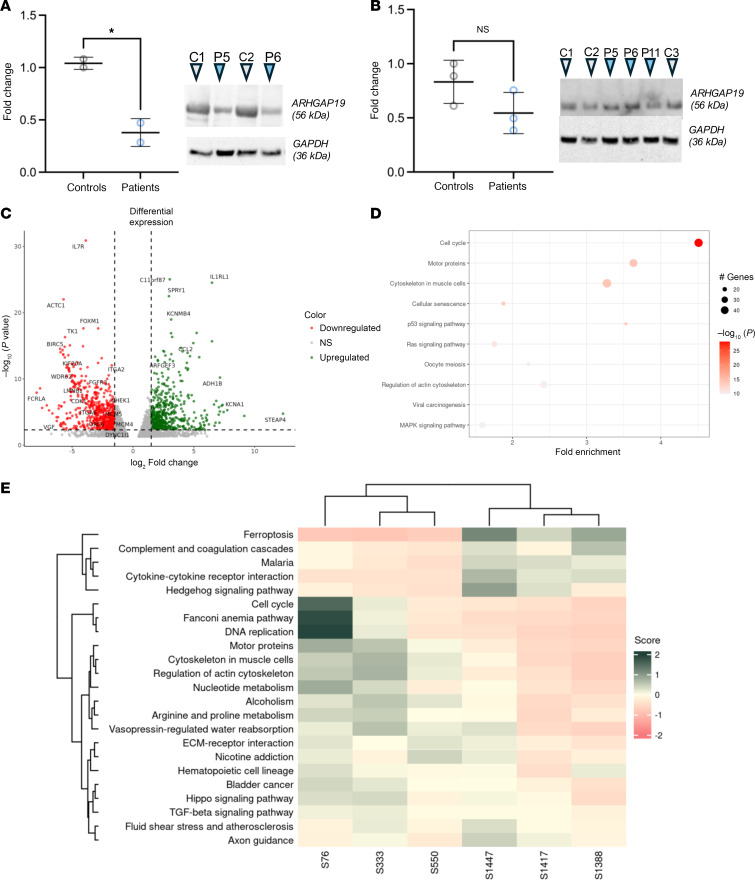
Figure 4 Western blot and RNA-seq analyses confirm downregulation of ARHGAP19 as well as cell cycle, motor, and muscular cytoskeleton pathways.

(A and B) Protein expression levels of ARHGAP19 in iPSc-derived SMN lines (A) and patient-derived fibroblasts (B). Fibroblasts from P5 (F5-II:2), P6 (F6-II:7), and P11 (F10-II:1) harboring the c.419G>A (p.Gly140Asp), c.203T>C (p.Leu68Pro), and c.85A>G (p.Asn29Asp) variants, respectively, were analyzed by Western blot, as well as fibroblast-derived iPSc SMNs from P5 (F5-II:2) and P6 (F6-II:7) patients. (C) Volcano plot showing log2 of fold change in ARHGAP19 mutants compared with controls and –log10 (adjusted P-value). (D) Pathway enrichment: differentially expressed genes with P value < 0.005 were selected for performing pathways enrichment analysis. Top 10 pathways with the highest enrichment scores were plotted, showing 3 cellular pathways highly enriched with dozens of affected genes and a very low P-value: cell cycle, motor proteins, and cytoskeleton in muscle cells. (E) Pathway scores per sample: enriched pathways were analyzed to compare their expression levels in patients and controls. Some pathways are overexpressed in patients while most of them are downregulated.

Acknowledgments
This image is the copyrighted work of the attributed author or publisher, and ZFIN has permission only to display this image to its users. Additional permissions should be obtained from the applicable author or publisher of the image. Full text @ Journal of Clin. Invest.