IMAGE

Fig. 2

ID
ZDB-IMAGE-251115-42
Antibodies
Source
Figures for Hunter et al., 2025
Image
Figure Caption

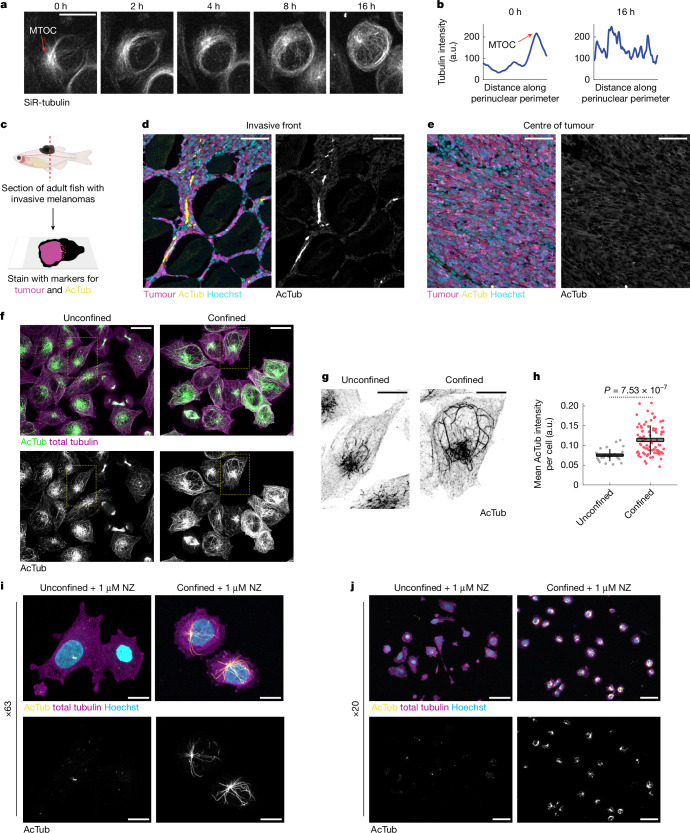
Fig. 2 Perinuclear acetylated tubulin cage assembles in response to confinement.

a, Representative stills from confocal imaging of A375 cells stained with SiR-tubulin. MTOC, microtubule-organizing centre. b, Line intensity profile of perinuclear tubulin intensity over time from the images shown in a. MTOC is highlighted (a,b). a.u., arbitrary units. c, Schematic detailing immunofluorescence staining of sections from adult zebrafish melanomas. d,e, Immunofluorescence images of acetylated tubulin staining at the invasive front (d) compared with the centre of the tumour (e). f, A375 cells stained with antibodies labelling acetylated tubulin (green) and total tubulin (purple). g, Inset of regions labelled in f. h, Quantification of whole-cell acetylated tubulin intensity. Each point represents one cell. Unconfined, n = 27 cells from three images; confined, n = 80 cells from nine images. Horizontal lines, mean; box, s.e.m.; vertical lines, s.d. P value is indicated (two-sample t-test; two-sided). i,j, A375 cells treated with 1-µm nocodazole (NZ) for approximately 18 h and stained for acetylated tubulin (yellow, top and bottom), total tubulin (purple) and Hoechst (blue) at ×63 (i) and ×20 (j) magnification. Scale bars, 50 µm (d,e,j), 20 µm (a,f), 10 µm (g,i). Illustrations in c were created using BioRender (https://biorender.com).

Source Data

Figure Data
Acknowledgments
This image is the copyrighted work of the attributed author or publisher, and ZFIN has permission only to display this image to its users. Additional permissions should be obtained from the applicable author or publisher of the image. Full text @ Nature