IMAGE

Figure 7.

ID
ZDB-IMAGE-251115-23
Source
Figures for Choudhury et al., 2025
Image
Figure Caption

Figure 7.

RNA-seq shows (p)ppGpp regulates hundreds of genes in response to reactive oxygen species and pH stress, predominantly via derepression of the CodY regulon. RNA was extracted from bacterial cultures of WT, (p)ppGpp0,
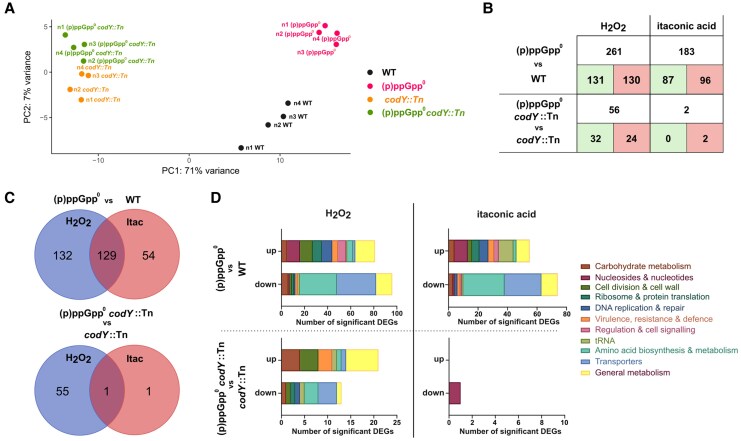
 codY::Tn, or (p)ppGpp0  codY::Tn that had been exposed to either 100 mM H2O2 or 20 mM itaconic acid for 10 minutes. Four biological replicates were performed per experimental condition. A, PCA of RNA-seq count data collected under H2O2-stress conditions. PCA plot was generated by DESeq2 on the Galaxy web platform. B, Number of significant DEGs in CodY-dependent (WT vs [p]ppGpp0) and CodY-independent backgrounds (codY::Tn vs [p]ppGpp0  codY::Tn), following H2O2 or itaconic acid stress. Green indicates upregulated genes, red represents downregulated genes. C, Overlaps between H2O2 or itaconic acid-induced stress responses in CodY-dependent and CodY-independent backgrounds. D, Functional categorization of significant DEGs using the KEGG mapper search tool. Hypothetical proteins are excluded for clarity. Abbreviations: (p)ppGpp, guanosine tetraphosphate/guanosine pentaphosphate; (p)ppGpp0, (p)ppGpp null mutant; DEG, differentially expressed gene; Itac, itaconic acid; PCA, principal component analysis; RNA-seq, RNA sequencing; WT, wild type.

Acknowledgments
This image is the copyrighted work of the attributed author or publisher, and ZFIN has permission only to display this image to its users. Additional permissions should be obtained from the applicable author or publisher of the image. Full text @ J. Infect. Dis.