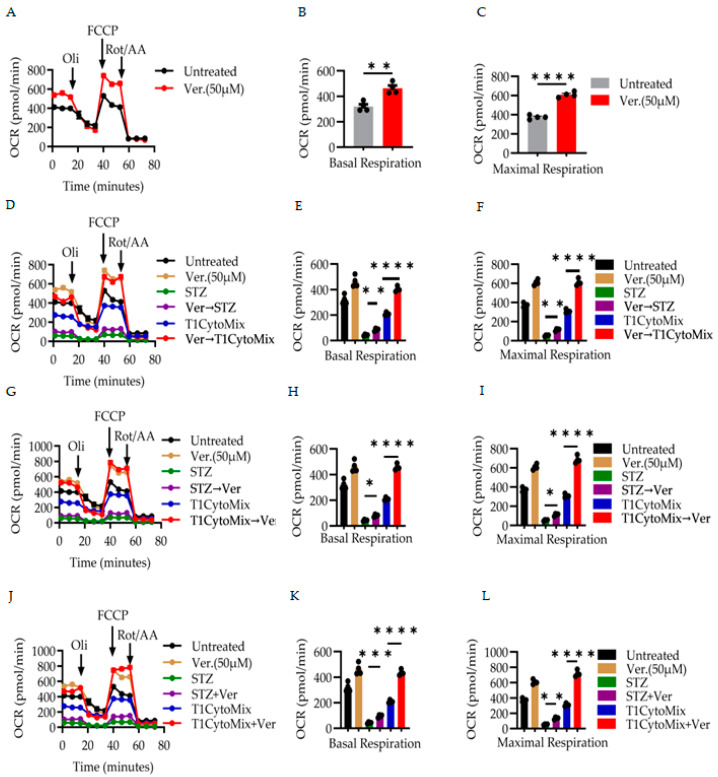
IMAGE

Figure 3

ID
ZDB-IMAGE-251115-161
Source
Figures for Arefanian et al., 2025
Image
Figure Caption

Figure 3

Verapamil enhances mitochondrial function in stressed MIN6 cells. To assess mitochondrial function, MIN6 cells were grown in a high-glucose medium and exposed to either diabetogenic stressors (STZ or a T1D-cytokine mix) with different timings of 50 µM verapamil treatment under pre-, post-, or co-treatment conditions. The cellular oxygen consumption rate (OCR) was measured by metabolic flux analysis following sequential treatment with 1 µM oligomycin, 2 µM FCCP, and 0.5 µM rotenone/antimycin A. (AC) Verapamil alone: 50 μM verapamil (24 h) increased both basal (B) and maximal (C) OCR compared to the untreated controls. (DF) Pre-treatment: cells pretreated with verapamil before stress exposure maintained higher basal respiration (E) and maximal respiration (F). (GI) Post-treatment: verapamil administration after stress improved basal OCR (H) and maximal OCR (I). (JL) Co-treatment: simultaneous verapamil + stressor treatment preserved basal respiration (K) and maximal respiration (L). The OCR data were normalized to the total protein extract measurements. The experimental groups were compared using two-way analysis of variance (ANOVA), with a statistically significant set at p-values < 0.05 considered statistically significant, and n = 4 per group. * p < 0.05, ** p < 0.01, *** p < 0.001, and **** p < 0.0001.

Acknowledgments
This image is the copyrighted work of the attributed author or publisher, and ZFIN has permission only to display this image to its users. Additional permissions should be obtained from the applicable author or publisher of the image. Full text @ Cells