
|
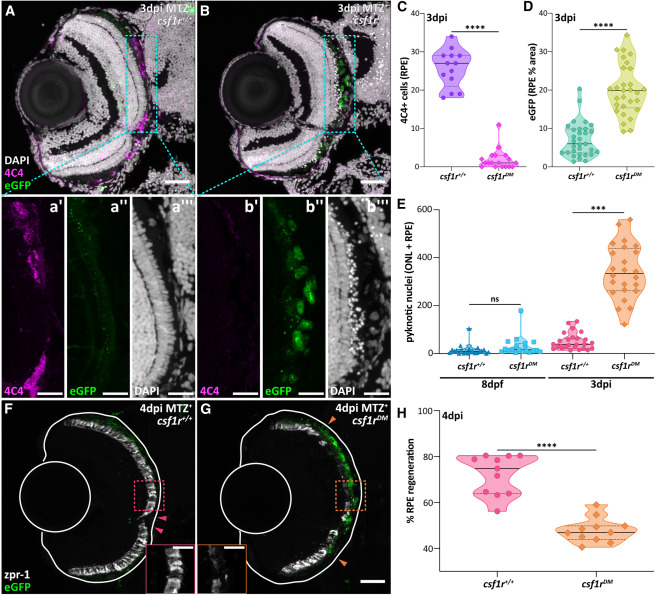
Fig. 5 Regeneration is severely impaired in 4 dpi csf1rDM larvae (A and B) Transverse confocal micrographs showing 4C4 (magenta) labeling in 3 dpi ablated (MTZ+) (A) csf1r+/+ and (B) csf1rDM larvae. (a’–b”’) Single-channel digital zooms (cyan outlines) highlight the (b’) lack of 4C4+ cells (magenta), accumulation of (b”) ablated eGFP+ (green), and (b”’) pyknotic (white) debris in the csf1rDM animal. (C) Violin plots showing 4C4+ cell counts in ablated (MTZ+) csf1r+/+ and csf1rDM larvae at 3 dpi. (D and E) Violin plots showing (D) eGFP+ signal (% area) and (E) pyknotic nuclei counts in ablated (MTZ+) csf1r+/+ and csf1rDM larvae at 3 dpi. (F and G) Transverse confocal micrographs showing expression of the cone photoreceptor marker, zpr-1 (white), and RPE (green) in 4 dpi ablated (MTZ+) (F) csf1r+/+ and (G) csf1rDM larvae. Solid white lines outline the lens and outer limits (sclera) of the eye. Arrowheads designate the central-most limits of regenerated tissue. (H) Violin plots showing percent RPE regeneration in ablated (MTZ+) csf1r+/+ and csf1rDM larvae at 4 dpi. Scale bars, 40 μm; digital zoom scale bars, 20 μm; ns, not significant; ∗∗∗p ≤ 0.001 and ∗∗∗∗p ≤ 0.0001. Experimental replicates and statistical information can be found in Table S3.