
|
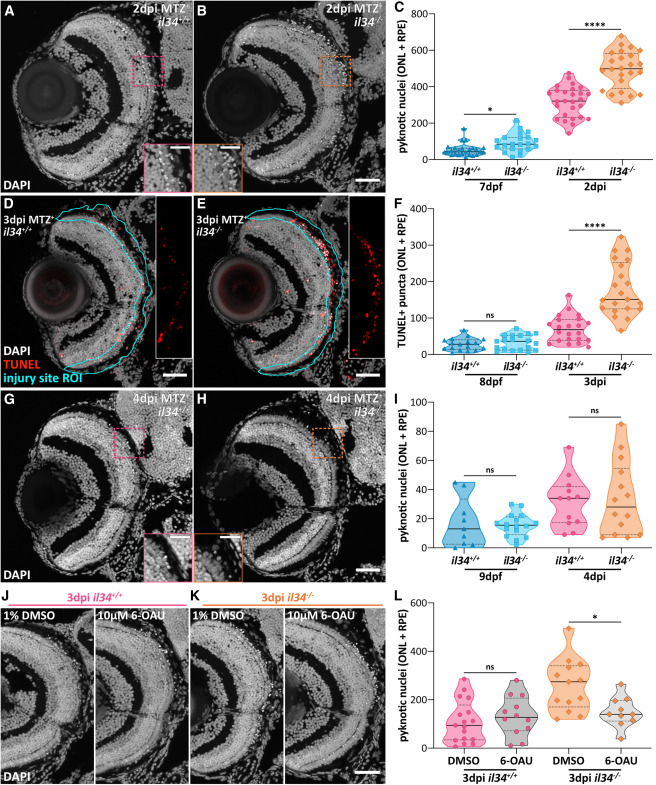
Fig. 3 il34 mutants retain apoptotic/necrotic cells at early time points post-injury (A and B) Transverse confocal micrographs showing DAPI counterstaining (white) in 2 dpi ablated (MTZ+) (A) il34+/+ and (B) il34−/− larvae. Digital zoom insets (orange and pink outlines) emphasize increased numbers of pyknotic nuclei in the il34−/− animal. (C) Violin plots showing pyknotic nuclei counts in 7 dpf unablated (MTZ–) and 2 dpi ablated (MTZ+) larvae. (D and E) Transverse confocal micrographs showing TUNEL labeling (red) in 3 dpi ablated (MTZ+) (D) il34+/+ and (E) il34−/− larvae. Cyan outlines designate regions of interest (ROIs) encompassing the photoreceptors (ONL) and RPE. Single-channel insets (no zoom) highlight increased numbers of TUNEL+ puncta in the il34−/− animal. (F) Violin plots showing quantification of TUNEL in 8 dpf unablated (MTZ–) and 3 dpi ablated (MTZ+) larvae. (G and H) Transverse confocal micrographs showing DAPI counterstaining (white) in 4 dpi ablated (MTZ+) (G) il34+/+ and (H) il34−/− larvae. Digital zoom insets (orange and pink outlines) emphasize minimal pyknotic nuclei in both animals. (I) Violin plots showing pyknotic nuclei counts in 9 dpf unablated (MTZ–) and 4 dpi ablated (MTZ+) larvae. (J and K) Transverse confocal micrographs showing DAPI counterstaining (white) in 3 dpi ablated (MTZ+) (J) il34+/+ and (K) il34−/− larvae treated with 1% DMSO or 10-μM 6-OAU from 1–3 dpi. (L) Violin plots showing pyknotic nuclei counts in DMSO- and 6-OAU-treated 3 dpi ablated (MTZ+) larvae. Scale bars, 40 μm in (B), (D), (E), (H), and (K) and 20 μm in (A), (B), (G), and (H) digital zooms; ns, not significant; ∗p ≤ 0.05 and ∗∗∗∗p ≤ 0.0001. Experimental replicates and statistical information can be found in Table S3.