
|
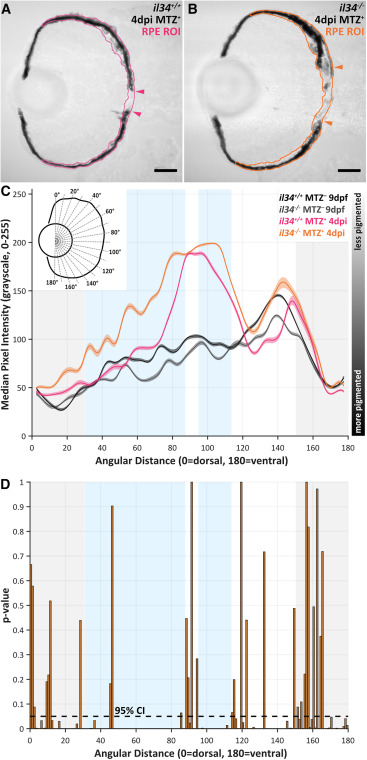
Fig. 1 RPE regeneration is impaired in il34 mutants at 4 dpi (A and B) Transverse confocal micrographs showing brightfield acquisitions of 4 dpi ablated (MTZ+) (A) il34+/+ and (B) il34−/− larvae. Orange and pink outlines encompass RPE regions of interest (ROIs). Arrowheads designate the central-most edges of intact RPE. Scale bars, 40 μm. (C and D) RpEGEN output plots showing (C) median pixel intensity values and 95% confidence interval (CI) envelopes (8-bit grayscale) and (D) p values spanning the dorsal (0°) to ventral (180°) angular distance of the RPE. (C) Ablated (MTZ+) il34−/− larvae (orange line) show higher (lighter/less pigmented) pixel intensities across the central two-thirds of the RPE compared to any other dataset. The inset shows a schematic of a larval eye with angular distance measurements from the dorsal-most (0°) to ventral-most (180°) RPE. y axis color bar indicates that more pigmented tissue is assigned a lower grayscale value (e.g., 0 = black), whereas less pigmented tissue is assigned a higher grayscale value (e.g., 255 = white). (D) Statistical comparison using a permutation simulation that compares median grayscale pixel intensity values between the two ablated (MTZ+) groups. Black dotted line represents p = 0.05. (C and D) Light blue regions highlight large central swathes where pigment recovery is significantly impaired in ablated il34−/− larvae. Gray regions designate the peripheral third of the RPE, which remains intact in this ablation model. Experimental replicates and statistical information can be found in Table S3.