
|
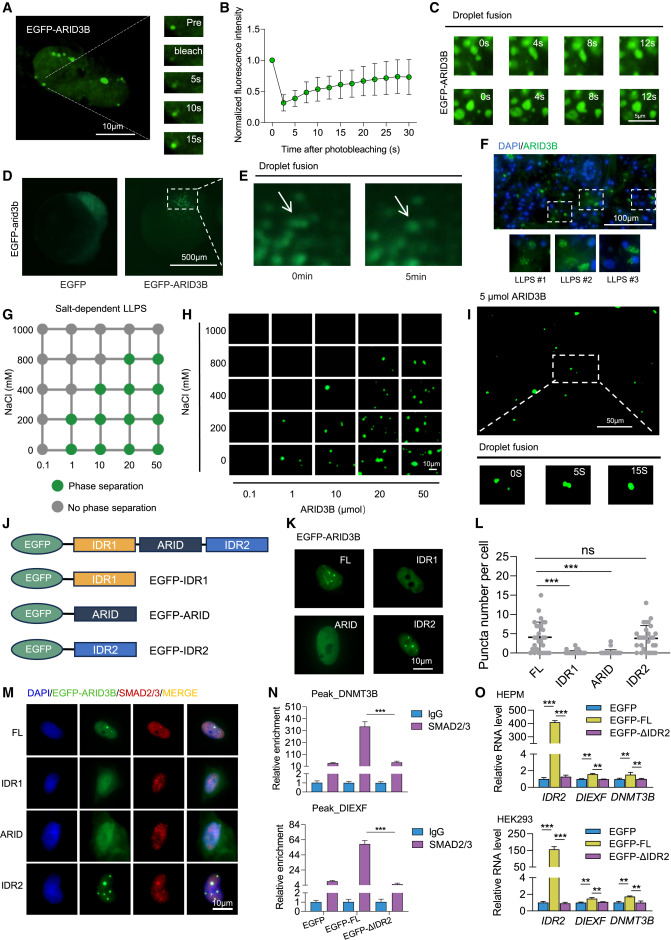
Fig. 6 Phase separation is essential for ARID3B function in transcription activation (A) Representative time-lapse FRAP images of EGFP-ARID3B in HEPM. Scale bar, 10 μm. (B) Quantification of fluorescence intensity during the FRAP assay (n = 3). (C) Time-lapse images showing the fusion of two adjacent EGFP-ARID3B proteins in HEPM at 0–12 s. Scale bar, 5 μm. (D and E) Live-cell images showing that arid3b forms self-assembled granules (green) in zebrafish embryonic cells at 2 hpf. Scale bars, 500 μm. (F) ARID3B forms granular condensates in human embryonic palatal tissue. The arrows represent the phase-separated condensates formed by ARID3B. Scale bars, 100 μm. (G) Summary of the phase separation behavior of ARID3B. (H) Representative fluorescence microscopy images. Scale bar, 10 mm. (I) Time-lapse images showing the aggregation of smaller EGFP-ARID3B granules into larger spherical granules in vitro. Scale bar, 50 mm. (J) Schematic diagram of the full-length ARID3B protein and the IDR1, ARID, and IDR2 domains of the ARID3B protein. (K) Representative images of HEPM cells overexpressing EGFP-ARID3B truncation mutants. Scale bar, 10 μm. (L) Quantification of the droplet number of EGFP-ARID3B truncation mutants. (M) Immunofluorescence staining of SMAD2/3 in HEPM cells transfected with the indicated mutants (left). Scale bar, 10 μm. (N) Transfection of ARID3B truncation mutants into ARID3B-knockout cells revealed that loss of IDR2 significantly reduces SMAD2/3 chromatin occupancy in DNMT3B and DIEXF loci. (O) The expression levels of DNMT3B and DIEXF were detected through RT-qPCR after overexpressing either EGFP, EGFP-FL, or EGFP-ΔIDR2. Data are presented as mean ± SEM (n = 3). ∗∗p < 0.01 and ∗∗∗p < 0.001; ns, not significant.