
|
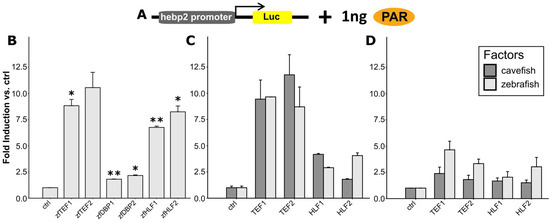
Fig. 7 Activation of hebp2-Luc by the PAR transcription factors in PAC-2 and EPA cells. (A) Schematic representation of the transfected plasmids: 50 ng hebp2-Luc and 1 ng of the PAR factors expression vectors. The arrowhead denotes the startpoint and direction of transcription from the promoter. (B–D) In vitro bioluminescence assay results of zebrafish PAC2 cells cotransfected with the hebp2-Luc luciferase reporter and each of the 6 zebrafish PAR factors expression vectors (n = 3) (B), the zebrafish and cavefish TEF and HLF factors (C), and EPA cells transfected with the zebrafish and cavefish TEF and HLF factors (N = 3). Cells were maintained in darkness for 48 h before lysis. Fold induction of relative bioluminescence compared to the control, and mean ± SEM are plotted. A β–galactosidase assay was used to normalize for transfection efficiency. Differences between zebrafish transcription factors and the control are compared via t-tests with Bonferroni correction. Detailed statistical analysis can be found in Supplementary Material 1. p < 0.5, p < 0.01, and p < 0.001 are represented by *, **, and ***, respectively.