
|
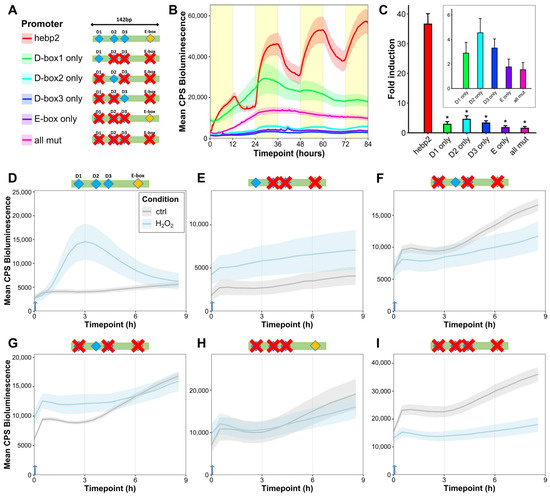
Fig. 6 D-box enhancers mediate light- and ROS-responsiveness of promoters of mitochondrial and heme-related genes. (A) Schematic representation of hebp2-Luc mutated constructs. The promoter fragment was mutated (indicated by red crosses) so only one predicted D-box or E-box element (or none) was retained. (B) Representative (of 3) in vivo bioluminescence assay in PAC-2 cells transfected with hebp2-Luc and its mutant constructs exposed to LD cycles. Mean bioluminescence (CPS) as a function of time (hours) is plotted. Lines show mean ± SEM across N = 6 wells. Lights-on periods are indicated by the yellow boxes. (C) In vitro bioluminescence assay of PAC-2 cells transfected with hebp2-Luc and its mutant constructs following 8 h exposure to blue light. Fold induction of relative bioluminescence levels compared with controls kept in darkness at a single timepoint, ± SEM (n = 3), is plotted on the y-axis. The β–galactosidase assay was used to normalize for transfection efficiency. Differences between the unmutated hebp2-Luc construct and each of the mutant constructs are compared via pairwise t-tests with Bonferroni correction. Detailed statistical analysis can be found in Supplementary Dataset S1. p < 0.5, p < 0.01, and p < 0.001 are represented by *, **, and *** respectively. (D–I) In vivo bioluminescence assays in PAC-2 cells treated with H2O2 after transfection with hebp2-Luc and its mutant constructs and kept in complete darkness. Traces from cells treated with 1 mM H2O2 starting at 0 h (blue arrow) are plotted in light blue; untreated controls are plotted in gray.