IMAGE

FIGURE 6

ID
ZDB-IMAGE-251105-48
Source
Figures for Owusu Poku et al., 2025
Image
Figure Caption

FIGURE 6

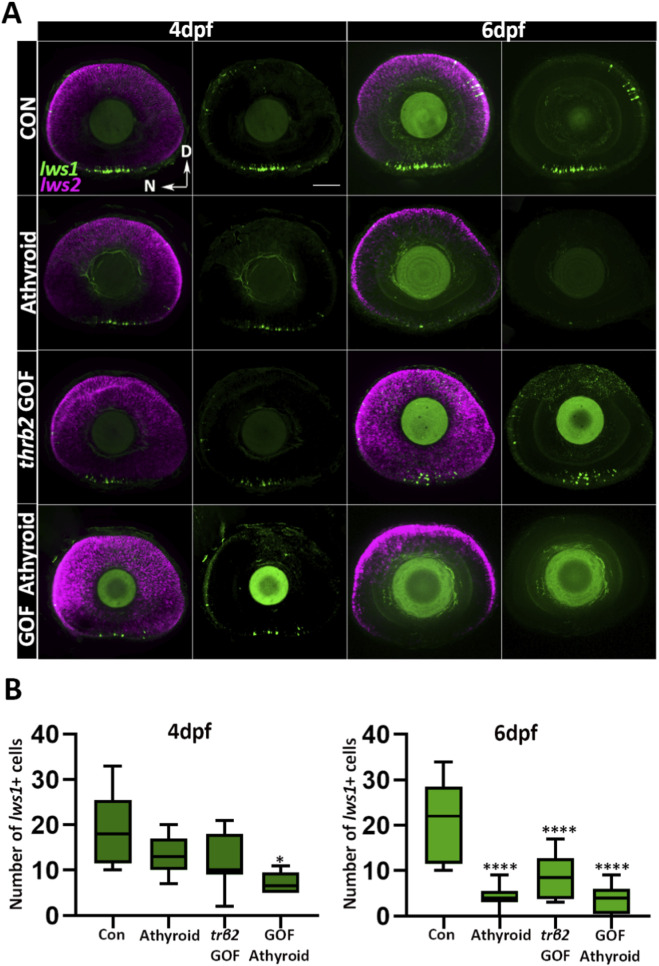
Unliganded Trβ2 delays the onset of lws1 expression. (A) Confocal microscopy images of whole-mounted larval retinas from a cross between Tg (crx: mYFP-2a-trβ2) and homozygous Tg (tg:nVenus-2a-nfnB) wp. rt8 transgenic lines. Larvae were treated with metronidazole or DMSO (control) for 24 h, then sorted for thyroid gland ablation at 4 or 6 dpf. (B) Quantification of lws1+ cells from confocal images at 4 and 6 dpf. N = 6 larvae. P-values were calculated by comparing lws1+ cell counts between groups using one-way ANOVA followed by Tukey’s post hoc test. Statistical significance is indicated as follows: *P < 0.05, **P < 0.01, ***P < 0.001, ****P < 0.0001. dpf: days post fertilization. D = Dorsal N = Nasal Scale bar = 50 μm.

Acknowledgments
This image is the copyrighted work of the attributed author or publisher, and ZFIN has permission only to display this image to its users. Additional permissions should be obtained from the applicable author or publisher of the image. Full text @ Front Cell Dev Biol