IMAGE

FIGURE 3

ID
ZDB-IMAGE-251105-45
Source
Figures for Owusu Poku et al., 2025
Image
Figure Caption

FIGURE 3

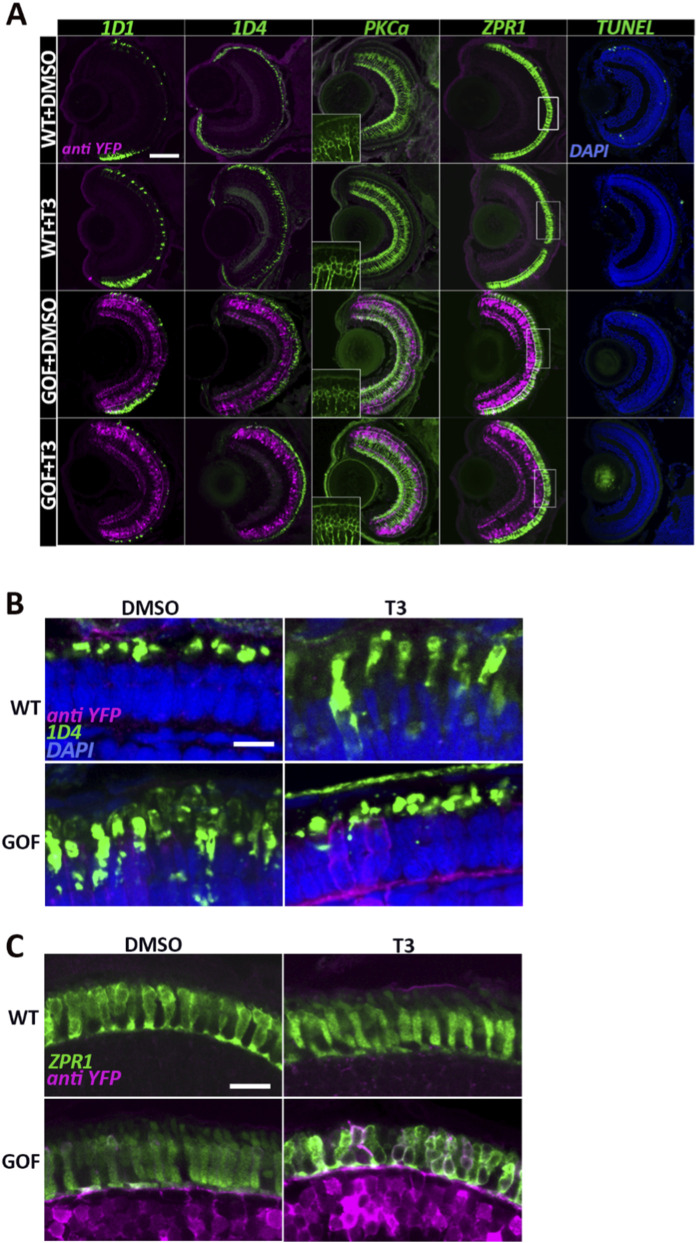
Trβ2 overexpression and T3 treatment alter cone morphology and/or distribution of selected cone antigens. (A) Confocal images of cryosectioned eyes from 6dpf wildtype and trβ2 GOF transgenic fish, immunolabeled for rod opsin (rho, 1D1), red opsin (1D4), bipolar cells (PKCα), and double cones (ZPR1). Insets in A show the PKCα channel only. Rectangular boxes in the ZPR1 column highlight regions magnified in C. (B) Higher magnification of images displaying 1D4 immunolabel, showing further changes in localization of Lws opsin(s). (C) Higher magnification of ZPR1 immunolabel in T3-treated trβ2 GOF transgenics, revealing changes in cone morphology and/or distribution of antigen. Scale bars in A = 50 μm, B and C = 5 μm.

Acknowledgments
This image is the copyrighted work of the attributed author or publisher, and ZFIN has permission only to display this image to its users. Additional permissions should be obtained from the applicable author or publisher of the image. Full text @ Front Cell Dev Biol