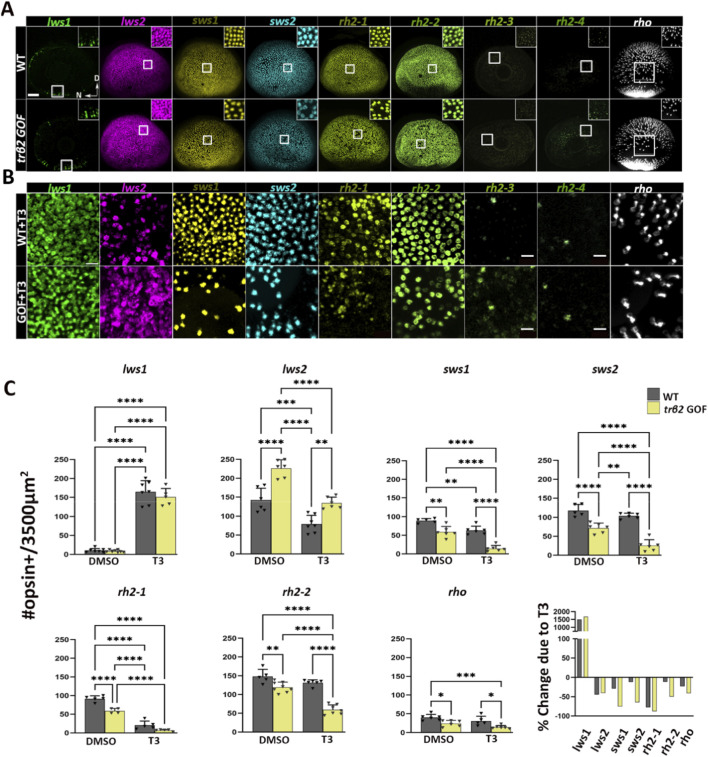
Expression patterns of nine opsin subtypes in 4dpf larval zebrafish eyes in wildtype vs. trβ2 gain-of-function under euthyroid and hyperthyroid conditions, detected using multiplex fluorescence in situ hybridization chain reaction (HCR). (A) Representative confocal projections of whole-mounted eyes from wildtype and Tg (crx:MYFP-2a-trβ2) larvae. In transgenics, lws2+ cone density is increased at the expense of other cone opsin + subtypes and rod opsin + cells. Insets show magnified views of boxed areas to highlight the cone mosaic structure. (B) Opsin mRNA localization within a 3500 μm2 area dorsal to the optic nerve head following treatment with 100 nM T3. In transgenic, T3-treated larvae, lws2, sws1, sws2, rh2-1, and rh2-2 positive cells (bottom row) are substantially reduced compared to T3-treated wildtype larvae (top row). (C) Scatter plot showing the average number of rod opsin+ and cone opsin + cells per unit area, quantified from confocal images of wildtype (gray) and transgenic (yellow) retinas. The final plot in C shows the % change in expression of indicated photoreceptor opsin in T3-treated vs. control, for 3,500 μm2 areas averaged over all samples. P-values were calculated using One-way ANOVA across four groups (WT + DMSO, WT + T3, GOF + DMSO, GOF + T3), followed by six pairwise post hoc comparisons (Tukey’s test). Statistical significance is represented as *P < 0.05, **P < 0.01, ***P < 0.001, ***P < 0.0001. N ≥ 6. D = Dorsal and N = Nasal. Scale bar in A = 50 μm.
Acknowledgments
This image is the copyrighted work of the attributed author or publisher, and
ZFIN has permission only to display this image to its users.
Additional permissions should be obtained from the applicable author or publisher of the image.
Full text @ Front Cell Dev Biol
Your Input Welcome
Thank you for submitting comments. Your input has been emailed to ZFIN curators who may contact you if
additional information is required.
Oops. Something went wrong. Please try again later.