IMAGE

Fig. 2

ID
ZDB-IMAGE-251105-40
Source
Figures for Kandettu et al., 2025
Image
Figure Caption

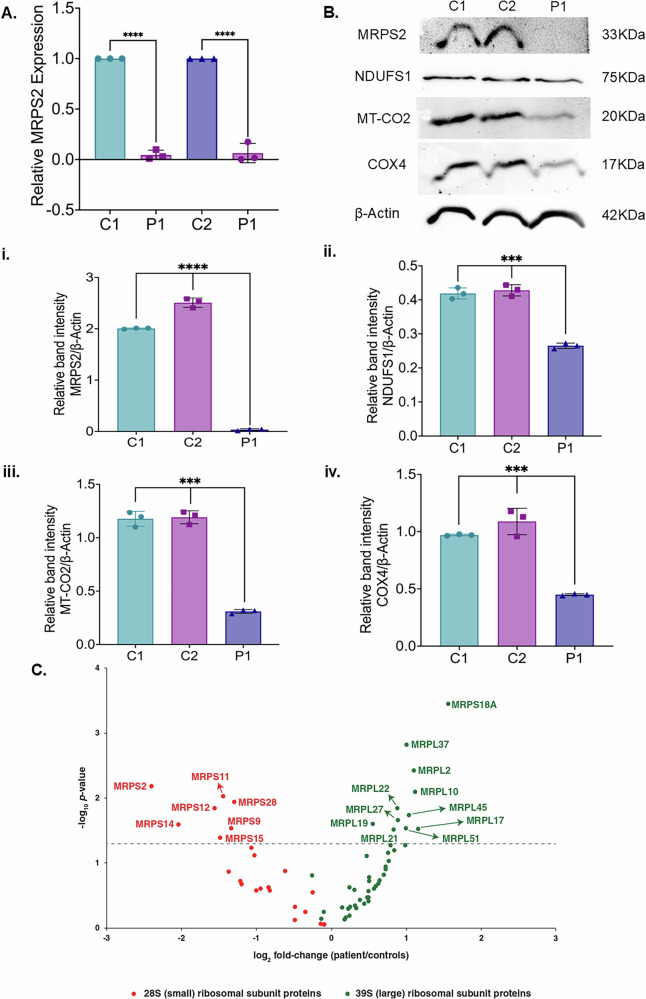
Fig. 2 Analysis of MRPS2 expression and OXPHOS proteins in controls and P1 patient derived cells.

A qRT-PCR analysis showing relative MRPS2 mRNA expression in control 1 (C1), control 2 (C2) and patient (P1) cell lines. Expression of MRPS2 in P1 was significantly upregulated when compared to C1 and C2. β-Actin was used as the internal control; B Representative blot images for protein expression of MRPS2, NDUFS1, MT-CO2 and COX4; (i-iv) Western blot analysis of protein expression of MRPS2, NDUFS1, MT-CO2 and COX4 in C1, C2 and P1 fibroblast cell lines. Densitometric analysis was performed upon normalization of MRPS2, NDUFS1, MT-CO2 and COX4 protein band intensity to respective β-Actin band. *p < 0.05, **p < 0.01, ***p < 0.001 and ****p < 0.0001; C Altered abundance of mitochondrial ribosomal proteins. A volcano plot showing alterations in the levels of various mitochondrial ribosomal subunit proteins. Small and large mitochondrial ribosomal subunit proteins are represented by red and green dots, respectively, as indicated. The horizontal dashed line corresponds to p = 0.05.

Acknowledgments
This image is the copyrighted work of the attributed author or publisher, and ZFIN has permission only to display this image to its users. Additional permissions should be obtained from the applicable author or publisher of the image. Full text @ Eur. J. Hum. Genet.