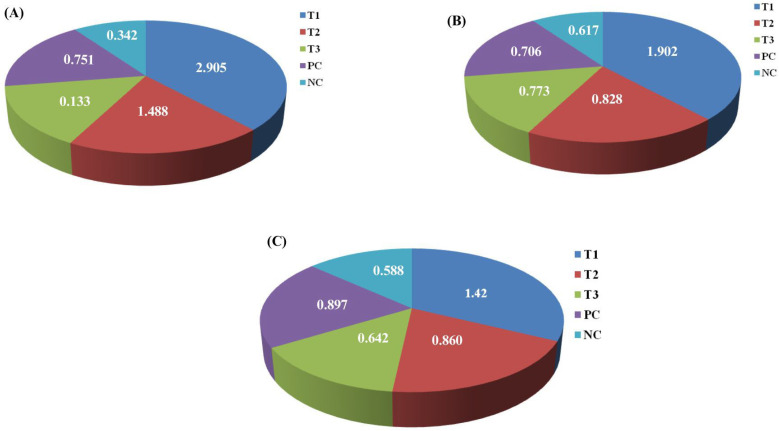
Pi-chart representation of calcium accumulation in various tissue samples across different experimental groups: (A) brain tissues; (B) intestinal tissues; (C) liver tissues. Highest concentration of calcium was observed in the T1 group tissue samples, indicating CaO-NP accumulation in all the organs. Note: All the different groups are represented using different colour codes; T1 is indicated by dark blue, T2 by red, T3 by green, the positive control by purple, and the negative control by cyan. NC = negative control; PC = positive control; T1 = Treatment 1 (2.4 mg CaO-NPs/kg feed); T2 = Treatment 2 (1.6 mg CaO-NPs/kg feed); T3 = Treatment 3 (0.8 mg CaO-NPs/kg feed).
Acknowledgments
This image is the copyrighted work of the attributed author or publisher, and
ZFIN has permission only to display this image to its users.
Additional permissions should be obtained from the applicable author or publisher of the image.
Full text @ Bioengineering (Basel)
Your Input Welcome
Thank you for submitting comments. Your input has been emailed to ZFIN curators who may contact you if
additional information is required.
Oops. Something went wrong. Please try again later.