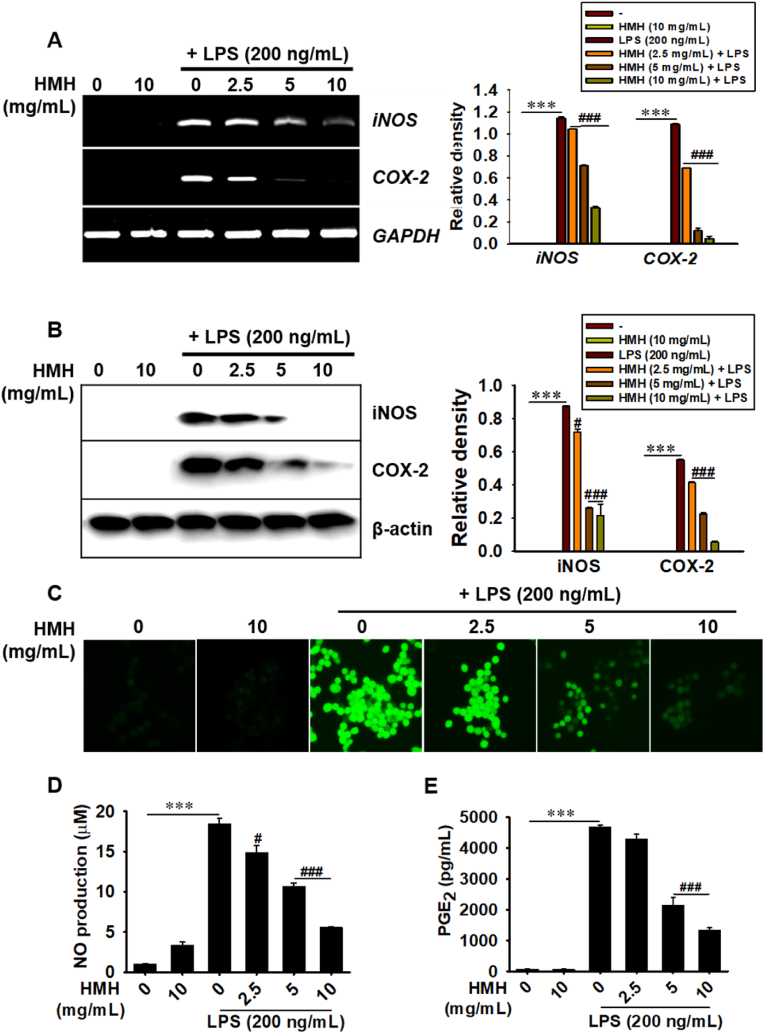
Image
Figure Caption

Fig. 2

HMH inhibits LPS-induced NO and PGE2 production. RAW 264.7 macrophages (1 × 105 cells/mL) were treated with HMH (0–10 mg/mL) for 2 h prior to LPS (200 ng/mL) treatment. (A) Total RNA was extracted 6 h after LPS treatment, and RT-PCR was performed to evaluate the expression of iNOS and COX-2. iNOS and COX-2 expression was normalized to GAPDH expression. (B) In a parallel experiment, total proteins were extracted at 12 h, and western blotting was performed to evaluate the expression of iNOS and COX-2. iNOS and COX-2 expression was normalized to β-actin expression. (C) Cells were stained using 1 μM DAF-FMDA, and the images were captured using a CELENA S Digital Imaging System. Cell-free culture media were collected 24 h after LPS treatment. (D) Griess reagent assay was performed to quantify NO production, and (E) PGE2 levels were quantified using an ELISA assay. ∗∗∗p < 0.001 vs. untreated cells; #p < 0.05 and ###p < 0.001 vs LPS-treated cells.

Acknowledgments
This image is the copyrighted work of the attributed author or publisher, and ZFIN has permission only to display this image to its users. Additional permissions should be obtained from the applicable author or publisher of the image. Full text @ J Tradit Complement Med