IMAGE

Figure 11

ID
ZDB-IMAGE-251029-50
Source
Figures for David et al., 2024
Image
Figure Caption

Figure 11 
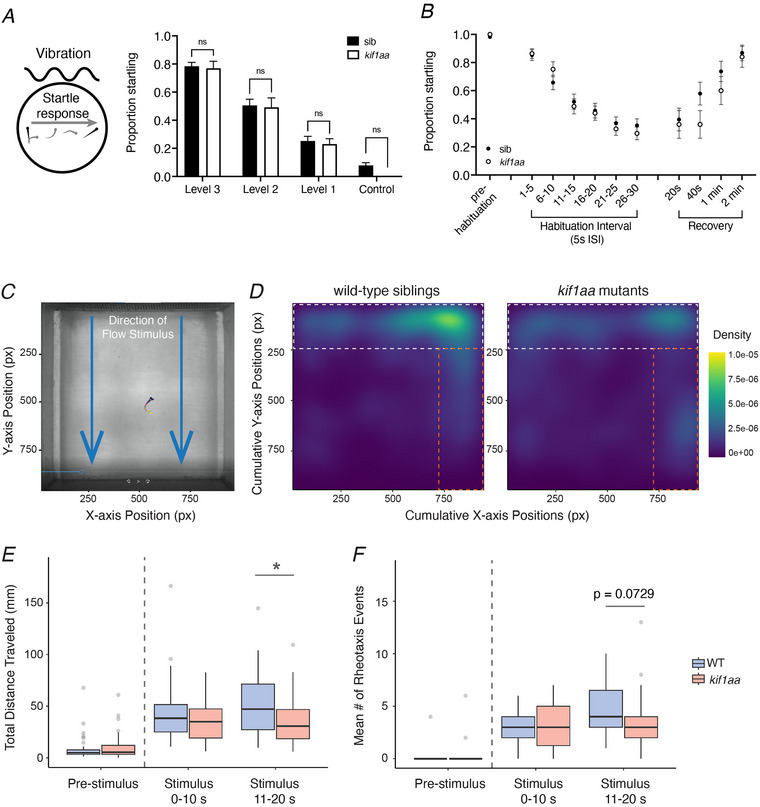
Station holding within flow, but not acoustic startle is impaired in kif1aa mutants

A, a vibrational‐acoustic tap stimulus was used to evoke an escape response in sibling control and kif1aa mutant larvae at three levels of decreasing intensity. Five stimuli per intensity level were administered, and the proportion of times each animal responded was plotted. No significant difference between kif1aa mutants and sibling controls was observed at any intensity tested (control: 0.78 ± 0.16 (Level 3), 0.51 ± 0.27 (Level 2), 0.25 ± 0.21 (Level 1), 0.08 ± 0.12 (no stimulus); kif1aa: 0.77 ± 0.18 (Level 3), 0.49 ± 0.24 (Level 2), 0.23 ± 0.14 (Level 1), 0 ± 0 (no stimulus); n = 38 control and 13 kif1aa larvae, two‐way ANOVA with multiple comparisons, P = 0.999 (Level 3–2), 0.994 (Level 1) and P = 0.586 for no stimulus control; 5 dpf). B, an acoustic startle habituation assay was used to assess whether kif1aa mutants respond to repeated stimuli. Here a series of 30 acoustic‐vibrational tap stimuli were delivered every 5 s. This assay shows that kif1aa mutants do not habituate or recover after habituation at a significantly different rate compared with sibling controls (n = 38 control and 25 kif1aa larvae, two‐way ANOVA with multiple comparisons, habituation: genotype × stimulus, P = 0.545 (and no significant difference at any interval); recovery: 40 s, P = 0.318; 1 min, P = 0.721; 2 min, P = 0.997). C, top‐down view of the working section of the microflume apparatus. Blue arrows indicate the direction of water flow. A larval fish performing behaviour is included for scale. D, two‐dimensional heat maps showing spatial use/cumulative positioning during flow stimulus. Wild‐type siblings (D) predominantly maintain position in the space at the front of the arena (white dotted lines) in the strongest part of the flow. Cumulative positioning in the source of the flow is reduced for kif1aa mutants (white vs. orange dotted lines), indicating impaired ability to station hold. E, box and whisker plots of total distance travelled during rheotaxis events. Under flow stimulus, the total distance travelled by kif1aa mutant larvae was significantly reduced compared with wild‐type siblings during the second half (11–20 s) of flow stimulus (control: 50.1 nm; kif1aa: 35.1 nm, adjusted P = 0.0170 (11–20 s)). F, box and whisker plots of the mean number of rheotaxis events. Under flow stimulus, kif1aa mutant larvae trended toward fewer rheotaxis events during the last half (11–20 s) of stimulus, though the difference was not significant (control: 4.5 events; kif1aa: 3.7 events, adjusted P = 0.0728). n = 43 wild‐type and 30 kif1aa mutant larvae were tested.

Acknowledgments
This image is the copyrighted work of the attributed author or publisher, and ZFIN has permission only to display this image to its users. Additional permissions should be obtained from the applicable author or publisher of the image. Full text @ J. Physiol.