IMAGE

Figure 8

ID
ZDB-IMAGE-251029-47
Source
Figures for David et al., 2024
Image
Figure Caption

Figure 8 
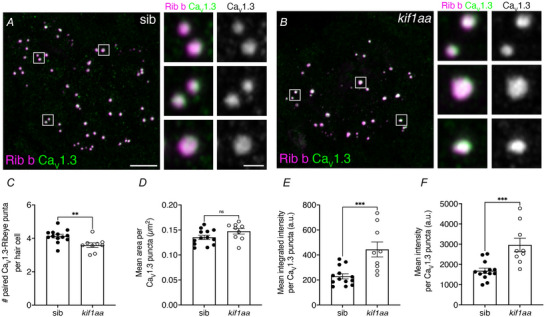
There are fewer paired Cav1.3‐Rib b puncta in kif1aa mutants

A,B, example immunostain of neuromasts at 5 dpf in kif1aa mutants (B) or sibling control (A). Ribeye b (Rib b) labels ribbons or presynapses, and CaV1.3 labels calcium channels. Insets to the side show high magnification images of individual synapses. C, the number of paired Rib b‐CaV1.3 puncta is significantly reduced in kif1aa mutants compared with sibling controls (control: 4.13 ± 0.39; kif1aa: 3.59 ± 0.41; n = 13 control and 9 kif1aa neuromasts, unpaired t test, P = 0.00550). D, the average size of CaV1.3 puncta was similar between sibling controls and kif1aa mutants (control: 0.14 ± 0.02; kif1aa: 0.15 ± 0.02, unpaired t test, P = 0.0953). E–F, the mean intensity and integrated intensity of CaV1.3 puncta were significantly higher in kif1aa mutants compared with controls (E, mean intensity, control: 1685 ± 459; kif1aa: 2961 ± 1002, unpaired t test, P = 0.000600; F, integrated intensity, control: 230 ± 73.6; kif1aa: 444 ± 180, unpaired t test, P = 0.0009). n = 13 control and 9 kif1aa neuromasts in C–F. Scale bars in A = 5 µm, inset is 0.5 µm.

Acknowledgments
This image is the copyrighted work of the attributed author or publisher, and ZFIN has permission only to display this image to its users. Additional permissions should be obtained from the applicable author or publisher of the image. Full text @ J. Physiol.